


If stocks fall on back-to-back days for the first time this month, you can probably blame an old culprit: Covid.
Yesterday was the biggest down day in a month, and it looks like the pullback is seeing a little follow-through, with stocks under pressure in pre-market trading despite solid earnings results. India is reporting a lot more cases, and while the U.S. has been injecting vaccine doses at a good clip, other parts of the world are struggling. We seem to have a pretty good handle on it here, but India and South America are two hotbeds.
As more earnings land, it’s becoming clear that despite optimism going in the results are actually better than expected. Several more big companies, including Procter & Gamble PG, Travelers TRV, Johnson & Johnson JNJ, and IBM IBM have reported since the market closed yesterday, and most of the results looked impressive, especially IBM—which has been an earnings disappointment more often than not in recent years.
None of that’s helping the overall market much, because stock futures extended Monday’s losses in the overnight session. It’s not too surprising to see some consolidation and profit-taking here after the long run we’ve had, but it’s been a while since the major indices fell two days in a row. You have to go back to March 29–30 for that with the S&P 500 Index (SPX).
Also, higher than expected earnings might not be packing as big a punch as normal, partly because analysts had been raising their earnings estimates before earnings season began, and at this point, it’s really more about what companies forecast and less about what happened in Q1.
With stocks stepping back and Covid still creating anxiety, volatility is starting to rise. The Cboe Volatility Index (VIX) rolled past 18 this morning. It’s nothing crazy so far, and it’s also kind of what you’d expect with stocks playing defense. The main thing to watch is whether VIX starts to threaten 20 again, which might hint at more serious turbulence in the markets. Even 20 is relatively low compared with where VIX has been. It stayed above 20 for a year after the pandemic crisis hit.
Though it may feel uncomfortable (and different, let’s face it) to see stocks going down, remember that there’s nothing really dramatic happening out there to cause it and no reason to panic. As they say in baseball, keep your eye on the ball. Analysts forecast 24% earnings growth in Q1, according to FactSet, and companies are mainly outpacing analysts’ expectations. Those are good things, and recent data indicate healthiness in the economy, too. The day-to-day moves in the major indices shouldn’t knock anyone off their overall trading plans or change anyone’s minds about the firm fundamental picture.
What To Watch On The Flight: Netflix And United Up Next
Two big earnings highlights to watch today are Netflix NFLX, where focus is likely to be on subscriber numbers, and United Airlines UAL, where investors will listen to its call for any indications of a bottom in air travel demand.
UAL’s results bowed last night, but its conference call is this morning. UAL was an exception to analysts being too conservative. Things looked generally worse than Wall Street had expected on both top-and bottom-line for the airline, but in its release UAL did cite “emerging pent-up demand” for travel to countries where vaccinated travelers are welcome. Q1 capacity, however, was down 54% from the same quarter in 2019 before the pandemic. UAL expects Q2 capacity to be a little better, down 45% from the same quarter two years ago.
Last week, Delta’s DAL earnings call offered a little optimism when their CEO said the airline is now seeing “more normal booking behavior” as customers make plans for spring and summer travel. From its release, it looks like UAL might see a similar scenario, but we’ll hopefully get a better sense of that from the call.
Lockheed Martin LMT is another behemoth reporting this morning, while the transport sector receives more spotlight later today when CSX CSX is expected to report. That might be a good chance to hear more about those supply chain backlogs some companies have been dealing with.
Stay tuned for Verizon VZ and Halliburton HAL tomorrow morning. HAL reports the same day as weekly crude inventories from the U.S. government. These are getting a bit more attention lately with crude prices approaching their 2021 highs and some big supply draws recently ahead of what might be a more typical summer “driving season” thanks to vaccinations. Seems like a lot of people are already out traveling.
Taking A Pause, But For How Long?
If you’d forgotten what a bad day feels like on Wall Street, Monday was your reminder. Losses for the major indices were the worst so far this month, but even with Monday factored in, the S&P 500 Index (SPX) remains up nearly 3.5% so far in April with 10 days left on the calendar. It’s up almost 11% year-to-date.
Nothing goes straight up forever, but a day like Monday doesn’t necessarily mean the long rally is losing steam, either. One indication of continued market strength was firmness in many of the commodities like crude, lumber, and copper. These keep climbing amid a reopening U.S. economy that could provide more demand for energy, new homes, and technology products that depend on raw materials.
Another sign that Monday might have been more of a pause then a reset could be a lack of much upward movement in volatility, along with continued softness in the dollar. The recent dollar weakness—which also could be supporting higher commodity prices, by the way—might also signal that investors remain bullish about the broader markets and don’t necessarily feel the need to run toward cash as a defensive strategy.
That said, you can also find analysts out there who worry that some technical indicators, like the Relative Strength Index (RSI), look pretty high right now, which is sometimes seen as a sign of an “overbought” market. The RSI for the SPX recently hit levels last seen in August, a month that came right before a pretty tough autumn for the market. Obviously there’s no guarantee of the same scenario happening again this time, but it might be something on peoples’ minds.
Yesterday’s selling hit the Tech market particularly hard, knocking the Nasdaq (COMP) down a full 1%. It’s worth noting that unlike the SPX and the Dow Jones Industrial Average ($DJI), there’ve been no new highs this month for COMP, which is loaded with Tech stocks. Also, the Russell 2000 (RUT) index of small-caps took it on the chin yesterday and hasn’t made a new high since mid-March.
Rising Treasury yields might have helped give Tech a pounding Monday, and Tech is under pressure again in pre-market trading Tuesday. The 10-year yield, however, is back below 1.6% after clawing above that yesterday to gain back some of the big losses it had last week.
Don’t count out the possibility that a daily dose of robust earnings results might be hard to trade against, if they continue. Seven S&P 500 companies reported Monday, and all seven beat the Street’s average earnings estimates. In addition, S&P Capital IQ raised its Q1 S&P 500 earnings growth estimate to 19.8%, from the previous 14.8%, based in part on that huge wave of positive bank earnings last week.
If there’s more weakness on Wall Street in the days ahead, look for possible technical support first at the 20-day moving average for the SPX, recently near 4045. Below that, there’s potential psychological support at 4,000 and at the 50-day of 3956 (see chart below).
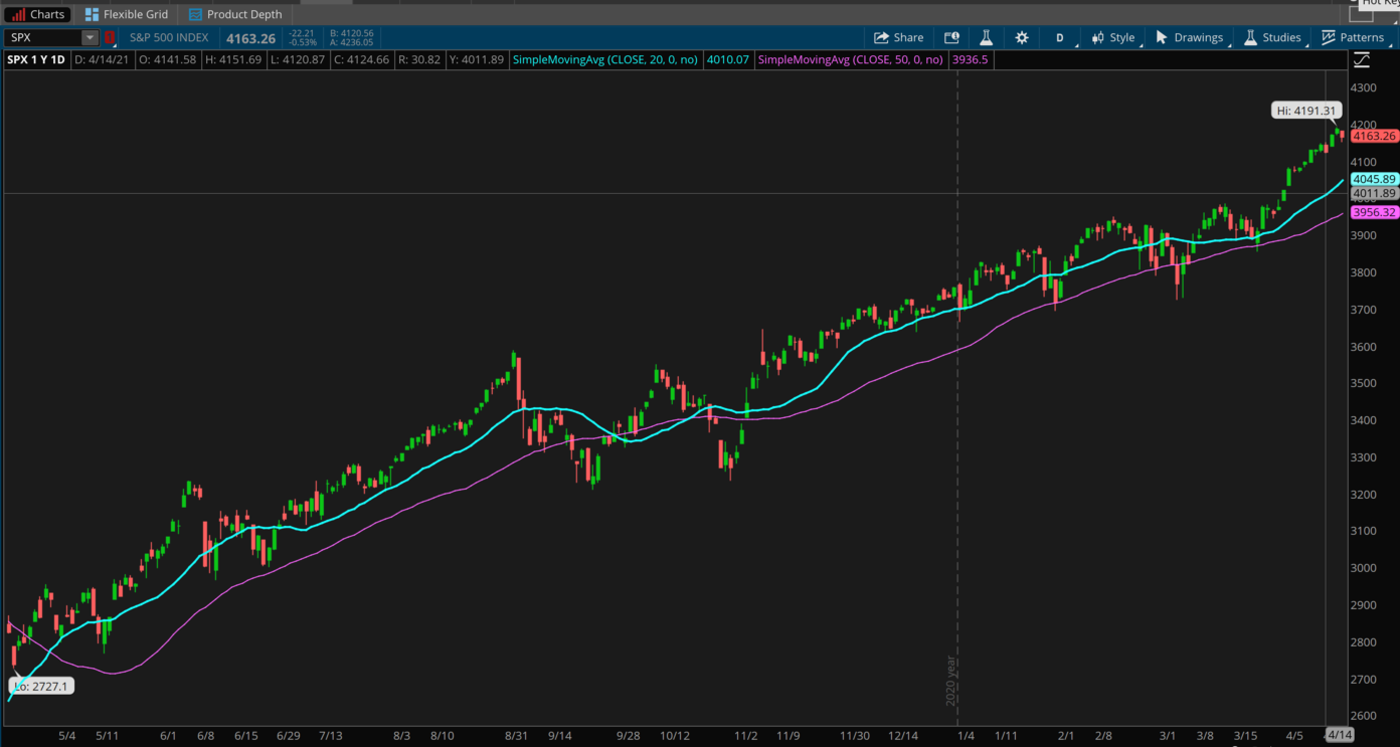
CHART OF THE DAY: JUST IN CASE. Though we haven’t had to talk much about technical support points lately in a market that keeps galloping higher, this chart of the S&P 500 Index (SPX—candlestick) shows the 20-day moving average (blue line) and the 50-day moving average (purple line), both possible points that might represent technical support if Monday’s selling spills over. Data Source: S&P Dow Jones Indices. Chart source: The thinkorswim® platform. For illustrative purposes only. Past performance does not guarantee future results.
Rolling Stock: There’s a little merger & acquisition buzz going on in the railroad industry. Kansas City Southern KSU shares gained 19% early Tuesday after the company received a competing bid from Canadian National Railway CNI. Canadian Pacific CP already presented an offer to buy the company, so now it looks like an old-fashioned bidding war. One thing that’s interesting about the bids to buy KSU: Action in the market this morning is kind of telling you that maybe the Street doesn’t like this deal so much. Shares of CP are higher even as they just got outbid. This should be an interesting one to watch, especially considering the importance of railways in shipping raw materials in an economy that’s reopening, and with supply chain backups being reported in many areas.
What Earnings Can Tell Us About Inflation: Commodity inflation can play into consumer perceptions of rising prices. This might explain why year-ahead inflation expectations from the University of Michigan consumer sentiment report Friday reached 3.7%—the highest level since 2012—and economists surveyed by The Wall Street Journal expect the Consumer Price Index to reach 3% by June. Inflation worries might also end up giving Treasury yields some new reasons to rally in coming weeks. One way to get a sense of where prices are going is to listen in on earnings calls for executives’ insight on costs.
CocaCola’s KO CEO weighed in during a CNBC interview yesterday, pointing out that KO is seeing some commodity cost issues. Though the company is well hedged for 2021, he said, there’s pressure built up for 2022. Those costs will translate into higher prices for some of KO’s products, he said. That’s just one CEO, but we’ll be keeping tabs on how often commodity and supply chain-related inflation come up on earnings calls this quarter. This can help provide a sense into whether those production costs ultimately end up affecting consumers.
Rally Breadth Puts New Life in Old Names: It’s one of those rare times when almost every part of the stock market is making investors money. Last week, the percentage of stocks in the S&P 500 trading above their 200-day moving averages crossed 95%, the highest level since October 2009, The Wall Street Journal reported, citing the unusual “breadth” of this rally. This is healthy, and contrasts sharply with 2019 and 2020 when a few “mega-caps” led major indices to huge gains while most stocks treaded water or even fell. One way you can measure the health of the current market is by noting that a few of the mega-caps—mainly Apple AAPL, AMZN, and Tesla TSLA—have either marched in place or dipped from highs, even as stocks that didn’t make many headlines the last two years showed new signs of life.
Which ones? Well, consider that the SPX was up just over 11% year-to-date coming into this week. Then look at some of the major “old line” companies which outpaced that. Names like Cisco CSCO, Oracle ORCL, Boeing BA, Lockheed Martin LMT, Walgreens Boots Alliance WBA, and Philip Morris PM come to mind. Then you have Barron’s pointing out that shares of Pilgrim’s Pride PPC—whose products you’ll find in the local grocery store—are up 23% year-to-date, doubling the return on the SPX. You know it’s a broad-based rally when even a poultry stock suddenly starts to sizzle. One thing to consider: In the past when this many stocks surpassed 200-day moving averages, the market tended to move flat to downward in the following weeks and months. The SPX was basically flat over the year following that October 2009 peak in stocks trading above the 200-day MA, for instance. Past isn’t predictive, obviously.
Image by Spencer Davis from Pixabay
© 2024 Benzinga.com. Benzinga does not provide investment advice. All rights reserved.
Date | ticker | name | Actual EPS | EPS Surprise | Actual Rev | Rev Surprise |
|---|
Trade confidently with insights and alerts from analyst ratings, free reports and breaking news that affects the stocks you care about.

