


With the ever-increasing number of trading platforms and the growing allure of low-to-no-fee brokerages, new traders are confronted with a deluge of options when it comes to trading and investing. But lost in the promises of sleek interfaces and free shares for signing up is the fact that successful trading takes time, practice and an understanding of resources experienced traders use on a daily basis.
Using the charts and tools available on the Webull trading app, which offers zero-commission trading and a suite of advanced trading analysis and charting, the Trader Toolkit series of articles will aim to explore the ratios, indicators and signals that play an integral role in how traders generate ideas and form convictions on their medium- or short-term trades.
Trading the contemporary market can sometimes feel like a constant game of catch up. The sheer amount of headline volatility that has roiled stocks in the past year, It’s almost become a foregone conclusion that another piece breaking geopolitical or economic news will arrive in the early morning hours and throw a wrench in whatever trends had managed to emerge from the previous days.
The market has always been susceptible to unexpected shocks from the political or economic worlds, so many traders rely on industry performance trends and heatmaps at the start of the day to guide their strategy until the closing bell.
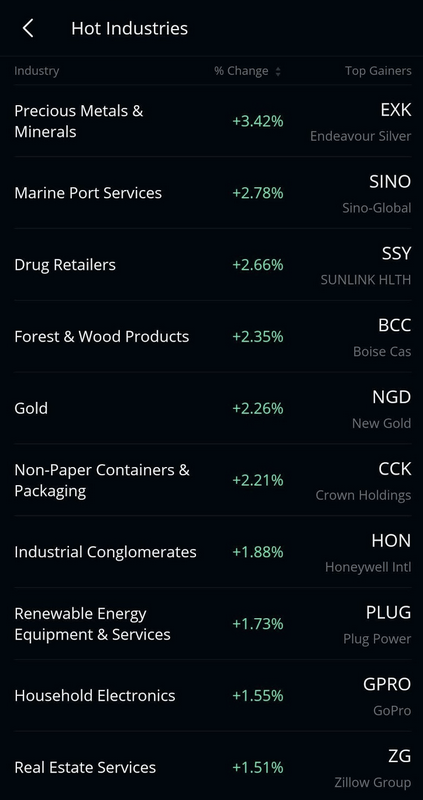
Take a look at one such industry indicator from zero-commission online broker Webull, which shows both the average industry performance as well as the top-performing stock within each segment.
Image courtesy of Webull

On the day that image was captured, gold and other precious metals were among the top-performing industries, with mining stocks Hecla Mining Company HL and New Gold Inc. NGD leading the charge. This might indicate increased caution in the market since gold, silver and platinum are the go-to safety assets when traders expect volatility, which demand ultimately benefits precious metal mining companies.
However, another high performing stock within the sampled industries is actually Crown Holdings, Inc. CCK in the non-paper containers and packaging segment. This seems odd, given that the industry is within the consumer cyclical sector, which is generally inversely correlated to precious metals and signs of volatility.
Clicking on the industry brings up a full list of the best-performing stocks in the segment. Looking over the results, it’s clear that Crown Holdings is an outlier among its peers.
Image courtesy of Webull

Additional investigation shows that Crown delivered a surprising EPS beat. This most likely attracted bullish investors to the industry as a whole, which in turn caused sympathy moves in similar packaging names that.
This is just one example of how an investor can use industry signals to guide their understanding of the daily trading environment. Users on the Webull app can also dig further into industry performance with a full ranking of the day’s industry performance, as shown below.
Image courtesy of Webull
Industry performance can be an extremely powerful and versatile tool for orienting traders for the day ahead. The information gleaned from a heat map can help traders screen for related or corollary stocks that might benefit from the overall currents of the daily market cycle.
Webull is a content partner of Benzinga
© 2024 Benzinga.com. Benzinga does not provide investment advice. All rights reserved.
Trade confidently with insights and alerts from analyst ratings, free reports and breaking news that affects the stocks you care about.


Your update on what’s going on in the Fintech space. Keep up-to-date with news, valuations, mergers, funding, and events. Sign up today!