


With more and more trading platforms and the growing allure of low-to-no-fee brokerages, new traders are confronted with a deluge of options when it comes to trading and investing. But lost in the promises of sleek interfaces and free shares for signing up is the fact that successful trading takes time, practice and an understanding of resources experienced traders use on a daily basis.
With that in mind, we’re going to use this new series of articles to take a look at the charts, ratios and indicators that play an integral role in how traders generate ideas and form convictions on their medium- or short-term trades. To do that, we’ll be using the charts and tools available on the Webull trading app, which offers traders access to real, zero-commission trading in addition to a suite of advanced trading analysis and charting.
Authority can be a dangerous asset when it comes to stocks and the stock market. While most traders profess to be experts in the corporate physics driving valuations and the whims of the stock market, very few have the track record to back them up.
However, when traders do appeal to authority, the people they look to for expertise are sell-side analysts—industry-specific experts who work with brokerages to give their opinion on the fundamental strength of a particular company. These analysts deliver their opinions in the form of notes which, in addition to a brief summary of the financial conditions of a specific company within the current economic environment, also provide their recommendation on how traders and investors should regard the stock and their estimate of where the stock’s price will be in the future, typically one year from the date it was issued.
This rating and price target are the core of these notes, and a rating decision from an influential analyst has the potential to move a stock significantly, either positive or negative. Each analyst might have their own way of phrasing these recommendations, from stocks labeled “buy” or “overweight,” to those that will “market perform” and those that will “underperform” which investors should “underweight.”
Basically, these are all just different ways of communicating the main things to do with a stock: “buy,” “hold,’ “sell.”
To get a sense of how analyst rating play out in a stock’s profile and begin to form a consensus, take a look at the preponderance of analyst ratings in Foot Locker, Inc. FL as shown in the no-fee trading platform Webull.
Image courtesy of Webull
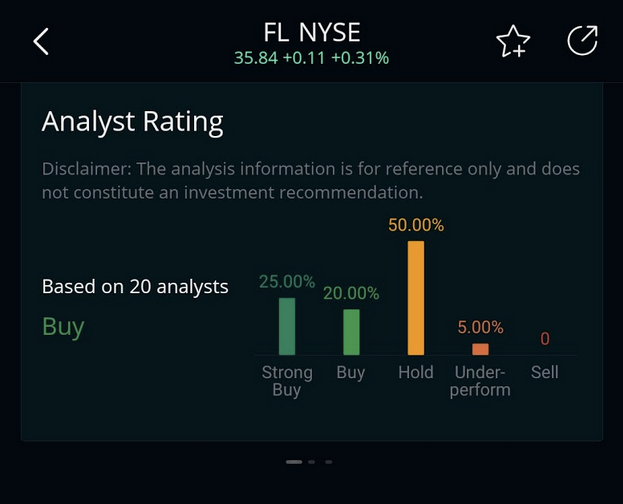
This breakdown speaks to the general utility of the “rating” portion of analyst ratings, which is to provide average investors a glimpse into the informed sentiment of people who know and understand the dynamics of a particular industry, in this case primarily retail, apparel and/or consumer cyclical analysts.
While fully half of the 20 analysts who have weighed in on Foot Locker have the stock at a neutral “Hold” rating, a sizable plurality of opinion also suggests buying the stock, some emphatically so. The result is the Webull platform’s overall “Buy” rating.
However, while the “buy” or “sell” aspect of an analyst note might help as a general form of investment guidance, traders can glean more specific insight into the growth of a specific stock based on each analysts projection for where the stock’s price will be 52 weeks in the future.
You can see the current range of analyst price targets in the graph below.
Image courtesy of Webull
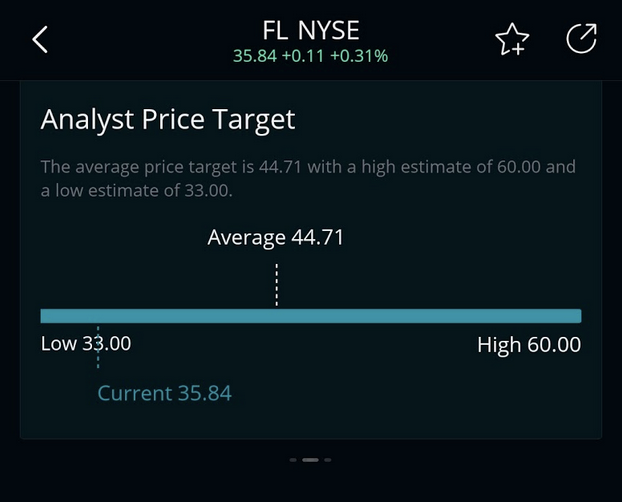
It should be stressed that price targets are based on the informed opinion of industry experts, and even those experts end up revising their targets and ratings to account for new information. While this chart indicates that the experts believe (on average) that Foot Locker’s stock is on the rise and will be about 25% higher by next year, keep in mind that’s based on current economic trends and the company’s current revenue projections.
Speaking of which, one final aspect of analyst ratings is the consensus estimate, which is the combined predictions of all the analysts who cover a particular stock. That consensus estimate serves as a benchmark when companies do report their actual quarterly revenue and earnings per share (EPS) figures.
Below is a chart illustrating how Foot Locker’s actual EPS has compared to analyst estimates over the past four quarters, as well as the current consensus estimate for the upcoming quarter.
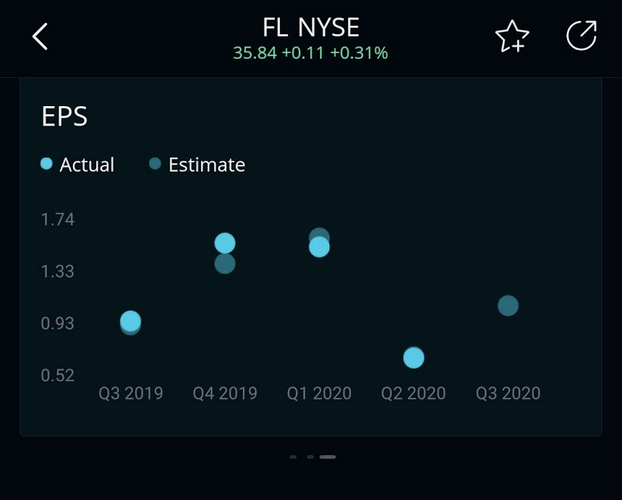
Image courtesy of Webull
This consensus estimate perhaps serves as the most influential estimate that analysts proffer since a low estimate can indicate a loss of potential value for current investors and an EPS miss on a quarterly report can have devastating effects on a company’s stock.
For the most part, Foot Locker has maintained a fairly steady reporting history, one that has also hew closely to analyst predictions. This might be one reason why analysts are overall bullish on the stock.
However, it should again be stressed that even these experts cannot account for every hiccup that a stock might experience. They are experts, but they can’t tell you what will happen tomorrow.
Webull is a content partner of Benzinga.
© 2024 Benzinga.com. Benzinga does not provide investment advice. All rights reserved.
date | ticker | name | Price Target | Upside/Downside | Recommendation | Firm |
|---|
Trade confidently with insights and alerts from analyst ratings, free reports and breaking news that affects the stocks you care about.


Your update on what’s going on in the Fintech space. Keep up-to-date with news, valuations, mergers, funding, and events. Sign up today!