


What factors do you consider when selecting stocks for your portfolio? Financial ratios are a popular choice, as are moving averages and insider activity. Maybe it’s a combination of some or all of these factors, or possibly something else entirely. There are, after all, countless ways to measure a stock’s worthiness as an investment.
That’s why multi-factor modeling — which incorporates information on individual assets and relationships between assets — is an essential resource among institutional traders and the ambition of retail traders seeking an all-in-one research tool. Although there are some retail-focused multi-factor models out there, most fail to balance their modeling with actionable analysis or clear insight into how and why assets might perform best within your overall portfolio strategy.
In an attempt to solve the challenge of giving retail investors access to concise, Bloomberg-caliber portfolio and investment analysis, Quantamize has launched its own interactive online investment research platform built on proprietary AI and multi-factor models. Stocks are broken down into easy-to-digest scores, rating them across four main factor themes to make it accessible and transparent for individual investors. The end result is the Quantamize online investment research platform serves as Bloomberg for the Average Investor.
Below, we’ll look at how the overall scoring system works and provide context for how that information is presented to optimize comprehensive and actionable portfolio strategies.
The Quantamize Q-Factor Scoring System
In order to act on a portfolio or investment idea, you need to first understand how and why a particular asset is valuable to your overall strategy. The Quantamize Q-Factor scoring system, which synthesizes quantitative, sentiment and fundamental data across all U.S. asset classes to arrive at an overall graded score from A to F, addresses this obstacle for individual investors.

The Quantamize Q-Factor scores provide an overall rating based on a stock’s strengths and weaknesses at a glance. An A score indicates that an asset is heavily undervalued in the context of a particular concept and represents “Top Buy” according to the AI multi-factor models, while an F indicates that asset is greatly overvalued in that concept, representing a “Top Short” candidate. Scores in between the binary ends of the scale — B, C and D — represent either attractive, neutral or unattractive characteristics of a particular asset.
This scoring model is used on several dimensions for each asset. As an example, take the ratings for shares of Ford Motor Company, Inc. F below:
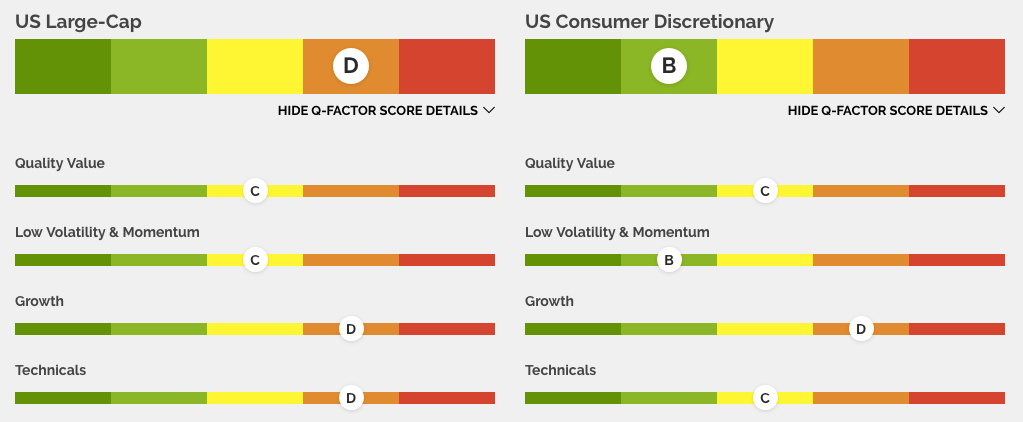
First, you can see that Ford has two different overall grades, one signifying its value as a U.S. large-cap stock and the other as a U.S. Consumer Discretionary stock. For traders eyeing Ford as a portfolio addition, the Q-Factor scores suggest that the stock represents a solid consumer discretionary position, although there are likely options within the sector with more valuable growth potential among other large-cap stocks.
This conclusion can be reached by looking at the four factor groups that drive the stock’s overall rating: quality value, low volatility and momentum, growth, and technicals. In both Q-Factor scores, Ford is graded as an unattractive growth candidate, which should prompt investors looking for stocks with growth potential to look elsewhere..
These four concepts further detail the asset’s relative value profile to provide comprehensive insight and guidance into the exact strengths and weakness of a particular asset.
Quality Value
Quality value represents an asset’s fundamental financial characteristics. It takes into consideration things like a stock’s price against company earnings, earnings quality, return profile of the business, and its price-to-book. Because the model takes overarching market relationships into consideration, its results also reflect valuation and quality characteristics of assets with similar exposures.
Low Volatility & Momentum
As opposed to quality value, the low volatility and momentum concept funnels data related to historical market performance. This covers a stock’s alpha and beta (returns and volatility) over anywhere from three months to three years. In some cases, it might consider the volatility of earnings streams or alternative data like the volatility of sentiment. The Q-Factor grade reflects not only each asset’s performance relative to its class or industry, but also its exposure to volatility and price spikes in correlated assets.
Growth
Growth measures company and industry financial metrics like sales and cash flow compared to industry and economic trends. These balance sheet metrics illustrate a company’s health, as well as its prospects for future growth. Like Quality Value, this concept is largely fundamental. The difference is the growth concept aims to forecast future performance based on current financial statistics, like long term debt to equity or M&A and R&D investments.
Technicals
Finally, the Q-Factor’s technical score incorporates common performance and momentum indicators, including moving averages and RSI calculations. The multi-factor model then compares these technical signals to macro influences, like risk exposure to a particular industry or the overall market, to arrive at an asset’s technical value.
Although multi-factor modeling at this scale is only possible with the aid of AI and machine learning, it should be clear that investors can still take an active role in understanding the core concepts underlying the technologies. While our brains might be limited by what we can reasonably pay attention to at a given moment, tools like Quantamize can help turn the massive amount of available information into actionable ideas.
Quantamize is a content partner of Benzinga
© 2024 Benzinga.com. Benzinga does not provide investment advice. All rights reserved.
Trade confidently with insights and alerts from analyst ratings, free reports and breaking news that affects the stocks you care about.


Your update on what’s going on in the Fintech space. Keep up-to-date with news, valuations, mergers, funding, and events. Sign up today!