


Marshallian K Indicator Turns Negative
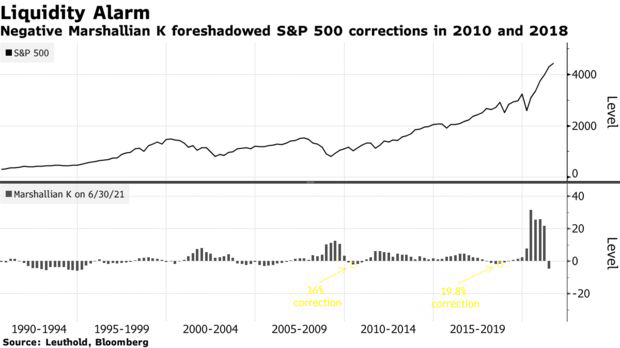
Leuthold Group Chief Investment Officer Doug Ramsey warned clients last week that the Marshallian K indicator falling below zero could presage a market correction. Marshallian K is essentially a measure of liquidity, the difference between the rate of growth of M2 money supply and the rate of growth of the economy. Bloomberg quoted Ramsey on it in an article on Wednesday ("Liquidity Is Evaporating Even Before The Fed Taper Hits Markets"):
“Put another way, the recovering economy is now drinking from a punch bowl that the stock market once had all to itself,” Doug Ramsey, Leuthold Group’s chief investment officer, wrote in a note last week.
How big a threat is this? While stocks kept rising during frequent negative Marshallian K readings in the 1990s, the pattern since the 2008 global financial crisis -- a period when the central bank was in what Ramsey calls a “perpetual crisis mode” -- begs for caution.
The Marshallian K fell below zero in 2010, a year when the S&P 500 Index suffered a 16% correction. A similar dip in 2018 portended a selloff that almost killed that bull market.


Market Valuation Increases Risk
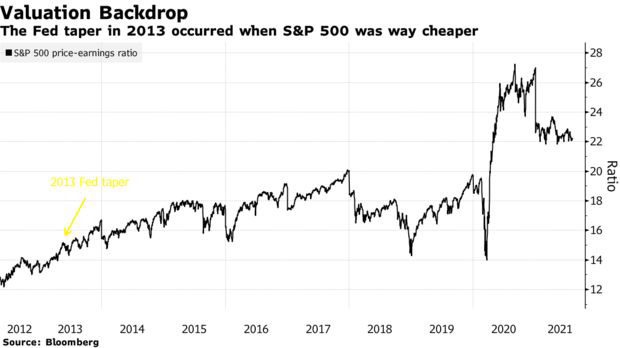
Bloomberg goes on to point out that today's elevated market valuation increases the risk factor. Unfortunately, the valuation chart they include in the article doesn't go back to 2010, but you can clearly see that the 2018 correction foreshadowed by the negative Marshallian K reading occurred when the S&P 500's P/E ratio was at about 18, and now it's at 22.
A Problem With Correction Predictions
We mentioned this recently, but it's worth repeating: whenever you read investment commentary, it's useful to ask what the writer is selling. In Doug Ramsey's case, his firm runs a tactical asset allocation strategy. In our case, we have a hedging app, so it's in our interest to pass along correction predictions. Nevertheless, we have to acknowledge a problem with correction predictions: they dramatically outnumber actual corrections. So we're not convinced a correction will follow this Marshallian K signal. But it might not hurt to add some downside protection just in case one does. That's particularly true given that it's relatively inexpensive to hedge market risk now. We'll show a simple way of doing so below.
Shields Up: Hedging Stock Market Risk
For the purposes of this example, we'll assume your portfolio is worth $500,000, and that it’s closely correlated with the SPDR S&P 500 Trust ETF SPY. We'll also assume you have enough diversification within it to protect against stock-specific risk, and that you can tolerate a decline of up to 10%. If you have a smaller risk tolerance, you can use the same approach entering a smaller decline threshold, Similarly, if you have a larger or smaller portfolio, you can adjust Step 1 below accordingly.
Step 1
Divide the dollar value of your portfolio by the current price of SPY. For this example, we'll use numbers as of Wednesday's close, but obviously, you'll use current data when you do it. SPY closed at $443.78 on Wednesday. Dividing $500,000 by $443.78, gets you 1,127 shares (rounded up).
Step 2
Scan for the optimal, or least expensive, puts to protect against a >10% decline in your number of shares of SPY at the options expiration you want. We've selected the November 19th expiration below. It's far enough out to give you some breathing room, and it's not too expensive.

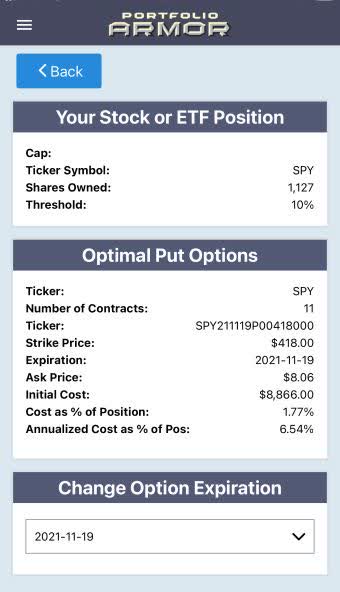
This and the next screen capture are via the Portfolio Armor iPhone app.
As you can see above, the number of options contracts the algorithm presented was 11. Since each options contract covers 100 shares, what our algorithm does when you enter a number containing an odd lot like 1,127 is this: it slightly over-hedges the round lots (the 1,100 shares, in this case), so that your entire position, including those extra 27 shares, is protected against the drawdown you specified.
Note the cost here: $8,866, or 1.77% of portfolio value. The app calculated that conservatively, using the ask price of the puts (in practice, you can often buy options at some price between the bid and ask prices).
Step 3
Round up the number of SPY shares to the nearest 100 and repeat step 2.

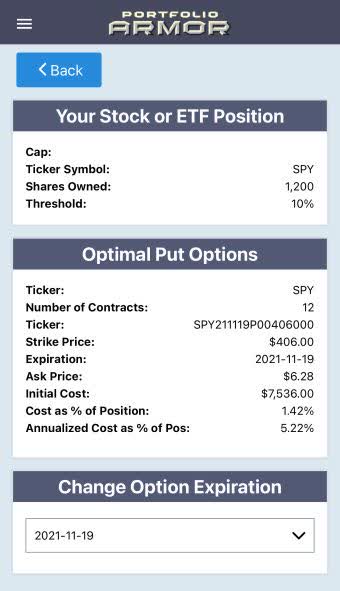
This time the cost was $7,536, or 1.42% of position value. Note that, in this case, it was cheaper to hedge 1,200 shares using the second hedge, so you would go with that.
If You Want To Stay In Touch
© 2024 Benzinga.com. Benzinga does not provide investment advice. All rights reserved.
Trade confidently with insights and alerts from analyst ratings, free reports and breaking news that affects the stocks you care about.

