


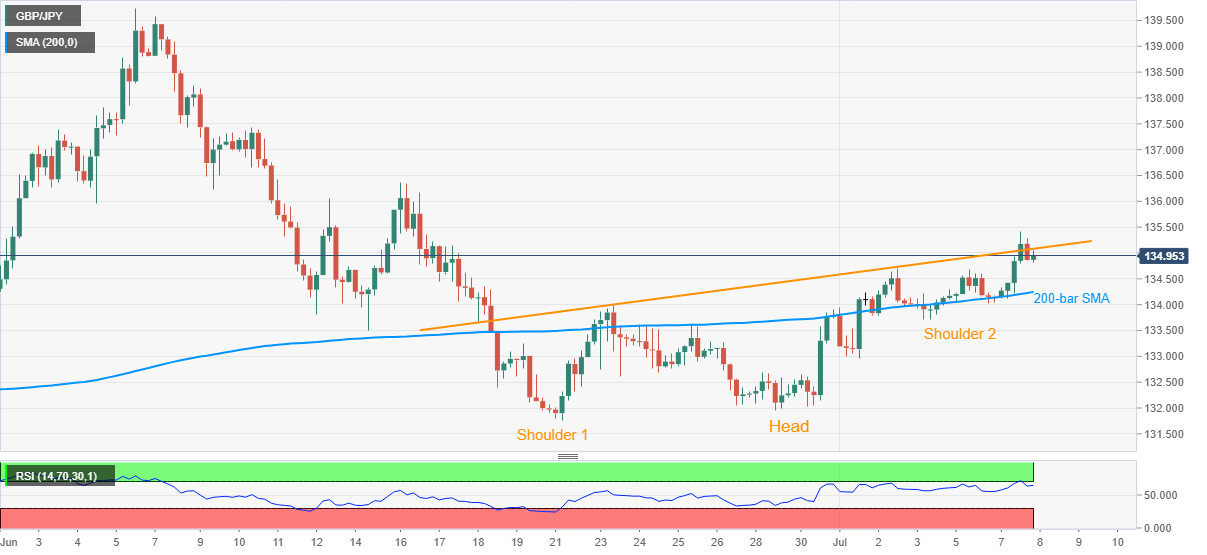
- GBP/JPY extends pullback from a three-week top of 135.41.
- Overbought RSI stopped buyers from confirming a bullish chart formation.
- Sustained trading beyond 200-bar SMA signals further upside.
GBP/JPY seesaws around 135.00 amid the pre-Tokyo open trading on Wednesday. The pair stepped back from a multi-day high after piercing the neckline of a short-term Head-and-Shoulders bullish technical formation on the four-hour chart the previous day. The reason could be traced from the RSI conditions.
However, the pair successful trading above 200-bar SMA favors the buyers to again confront the 135.10 resistance line to confirm the upside-suggesting pattern.
Following that, the mid-June top surrounding 136.40 might offer an intermediate halt during the pair’s rise towards the June month’s top near 139.75, closely followed by 140.00 psychological magnet.
Alternatively, the pair’s declines below the 200-bar SMA level of 134.25 can recall a 133.70/60 support zone.
In a case of the quote’s further weakness past-133.60, 133.00 might act as a buffer before diverting the bears towards 131.75, close to June 22 bottom.
GBP/JPY four-hour chart

Trend: Bullish
© 2024 Benzinga.com. Benzinga does not provide investment advice. All rights reserved.
Trade confidently with insights and alerts from analyst ratings, free reports and breaking news that affects the stocks you care about.

