


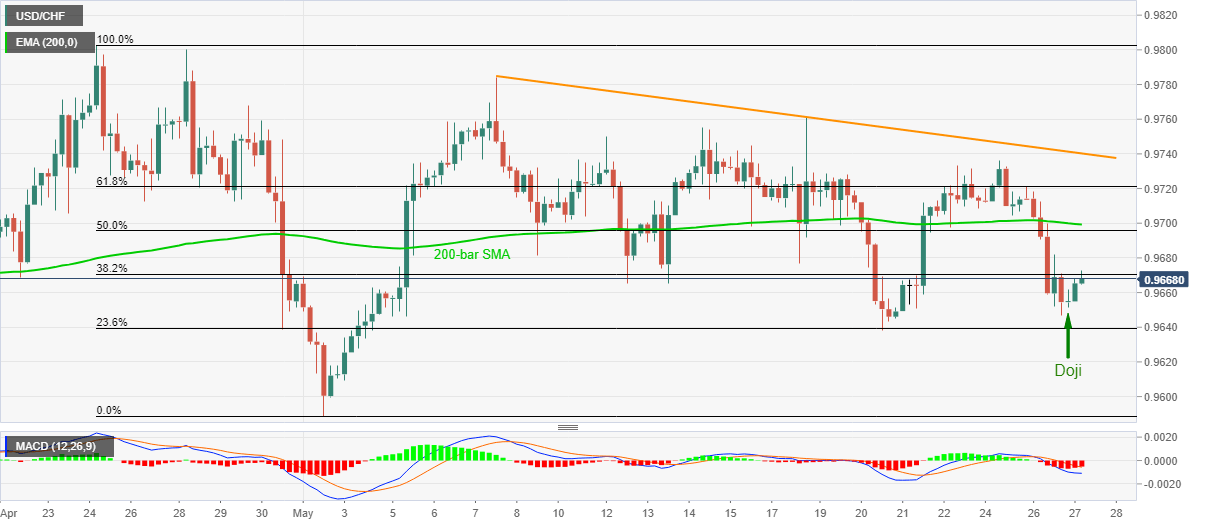
- USD/CHF recovers from 0.9652 following a bullish candlestick formation.
- 200-bar EMA, 61.8% Fibonacci retracement can check the pullback moves.
- Sustained break of 23.6% Fibonacci retracement will negate upside momentum.
USD/CHF portrays gradual recovery from the intraday low while taking the bids near 0.9670, up 0.13% on a day, during the pre-European session on Wednesday.
Considering the bullish Doji formation on the four-hour (H4) chart, odds of further upside towards a 200-bar EMA level of 0.9700 are high.
Should buyers manage to keep the reins past-0.9700, 61.8% Fibonacci retracement of April 24 to May 01 fall, around 0.9720, followed by a three-week-old falling trend line, near 0.9740, could question the bulls.
Alternatively, the pair’s declines below 0.9640, comprising 23.6% of Fibonacci retracement, could recall the bears targeting the monthly low near 0.9590.
USD/CHF four-hour chart

Trend: Further recovery expected
© 2024 Benzinga.com. Benzinga does not provide investment advice. All rights reserved.
Trade confidently with insights and alerts from analyst ratings, free reports and breaking news that affects the stocks you care about.

