


Loading...
Loading...
- Ripple's XRP price is trading in the green by some 1.30% in the session on Friday.
- XRP/USD bulls are attempting to break down the $0.2200-0.2400 region.
- A breakout of the above-noted resistance should open the door for a fast move into $).2500 and beyond.
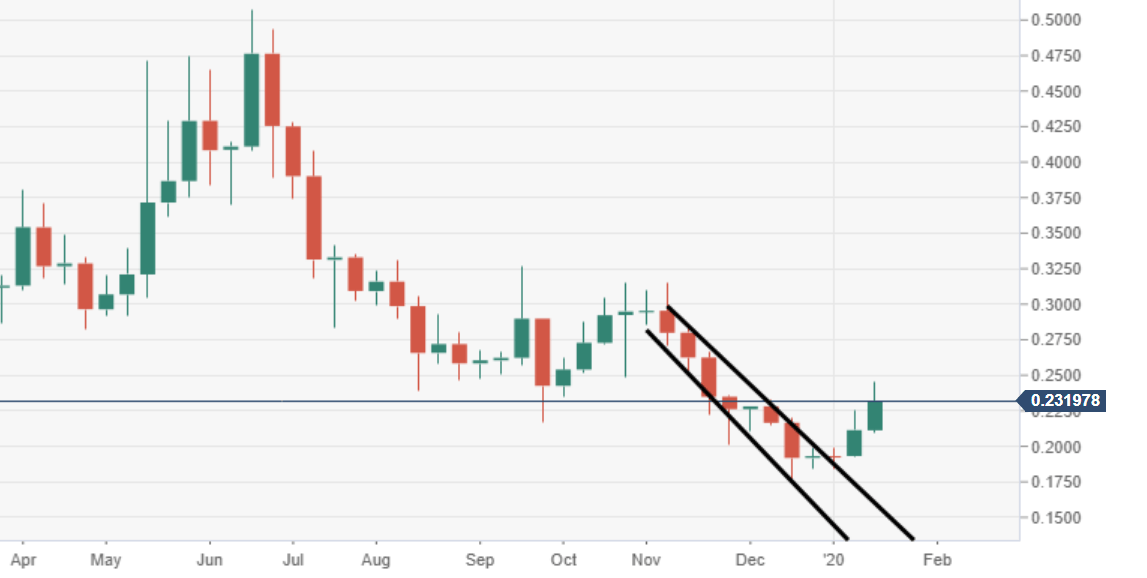
XRP/USD weekly chart
Decent bull momentum is being observed, as the price runs towards another week in the green. Further buying pressure came into play after a descending channel break was seen.

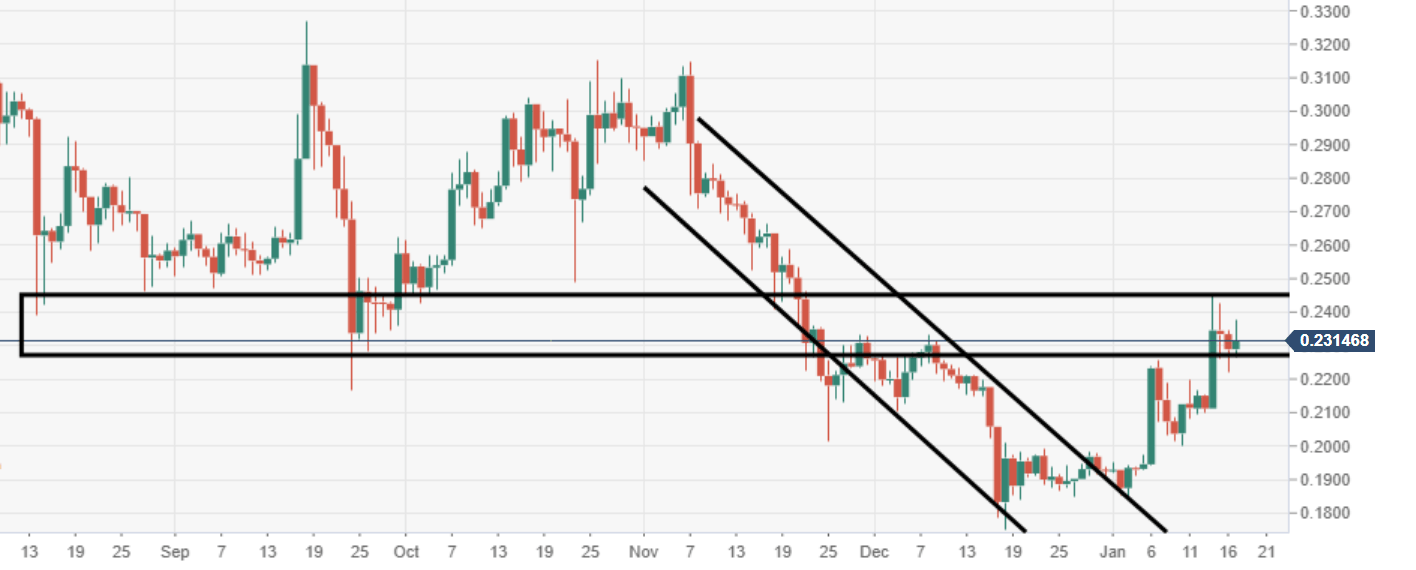
XRP/USD daily chart
The price is moving within consolidation mode, ahead of further moves north. As earlier noted, a break down of $0.2300-0.2400 needs to be seen.
Spot rate: 0.2319
Relative change: +1.30%
High: 0.2376
Low: 0.2264
© 2024 Benzinga.com. Benzinga does not provide investment advice. All rights reserved.
Posted In: TechnicalsForexMarketsTrading IdeasCrypto Currenciespivot pointsresistancesupporttechnical analysisTechnical Resistance
Benzinga simplifies the market for smarter investing
Trade confidently with insights and alerts from analyst ratings, free reports and breaking news that affects the stocks you care about.
Join Now: Free!
Already a member?Sign in

