


In last week’s Dow Thirty report, Eagle Bay Capital founder and Market Technician JC Parets and his team look into two Intel Corporation INTC charts every investor should see.

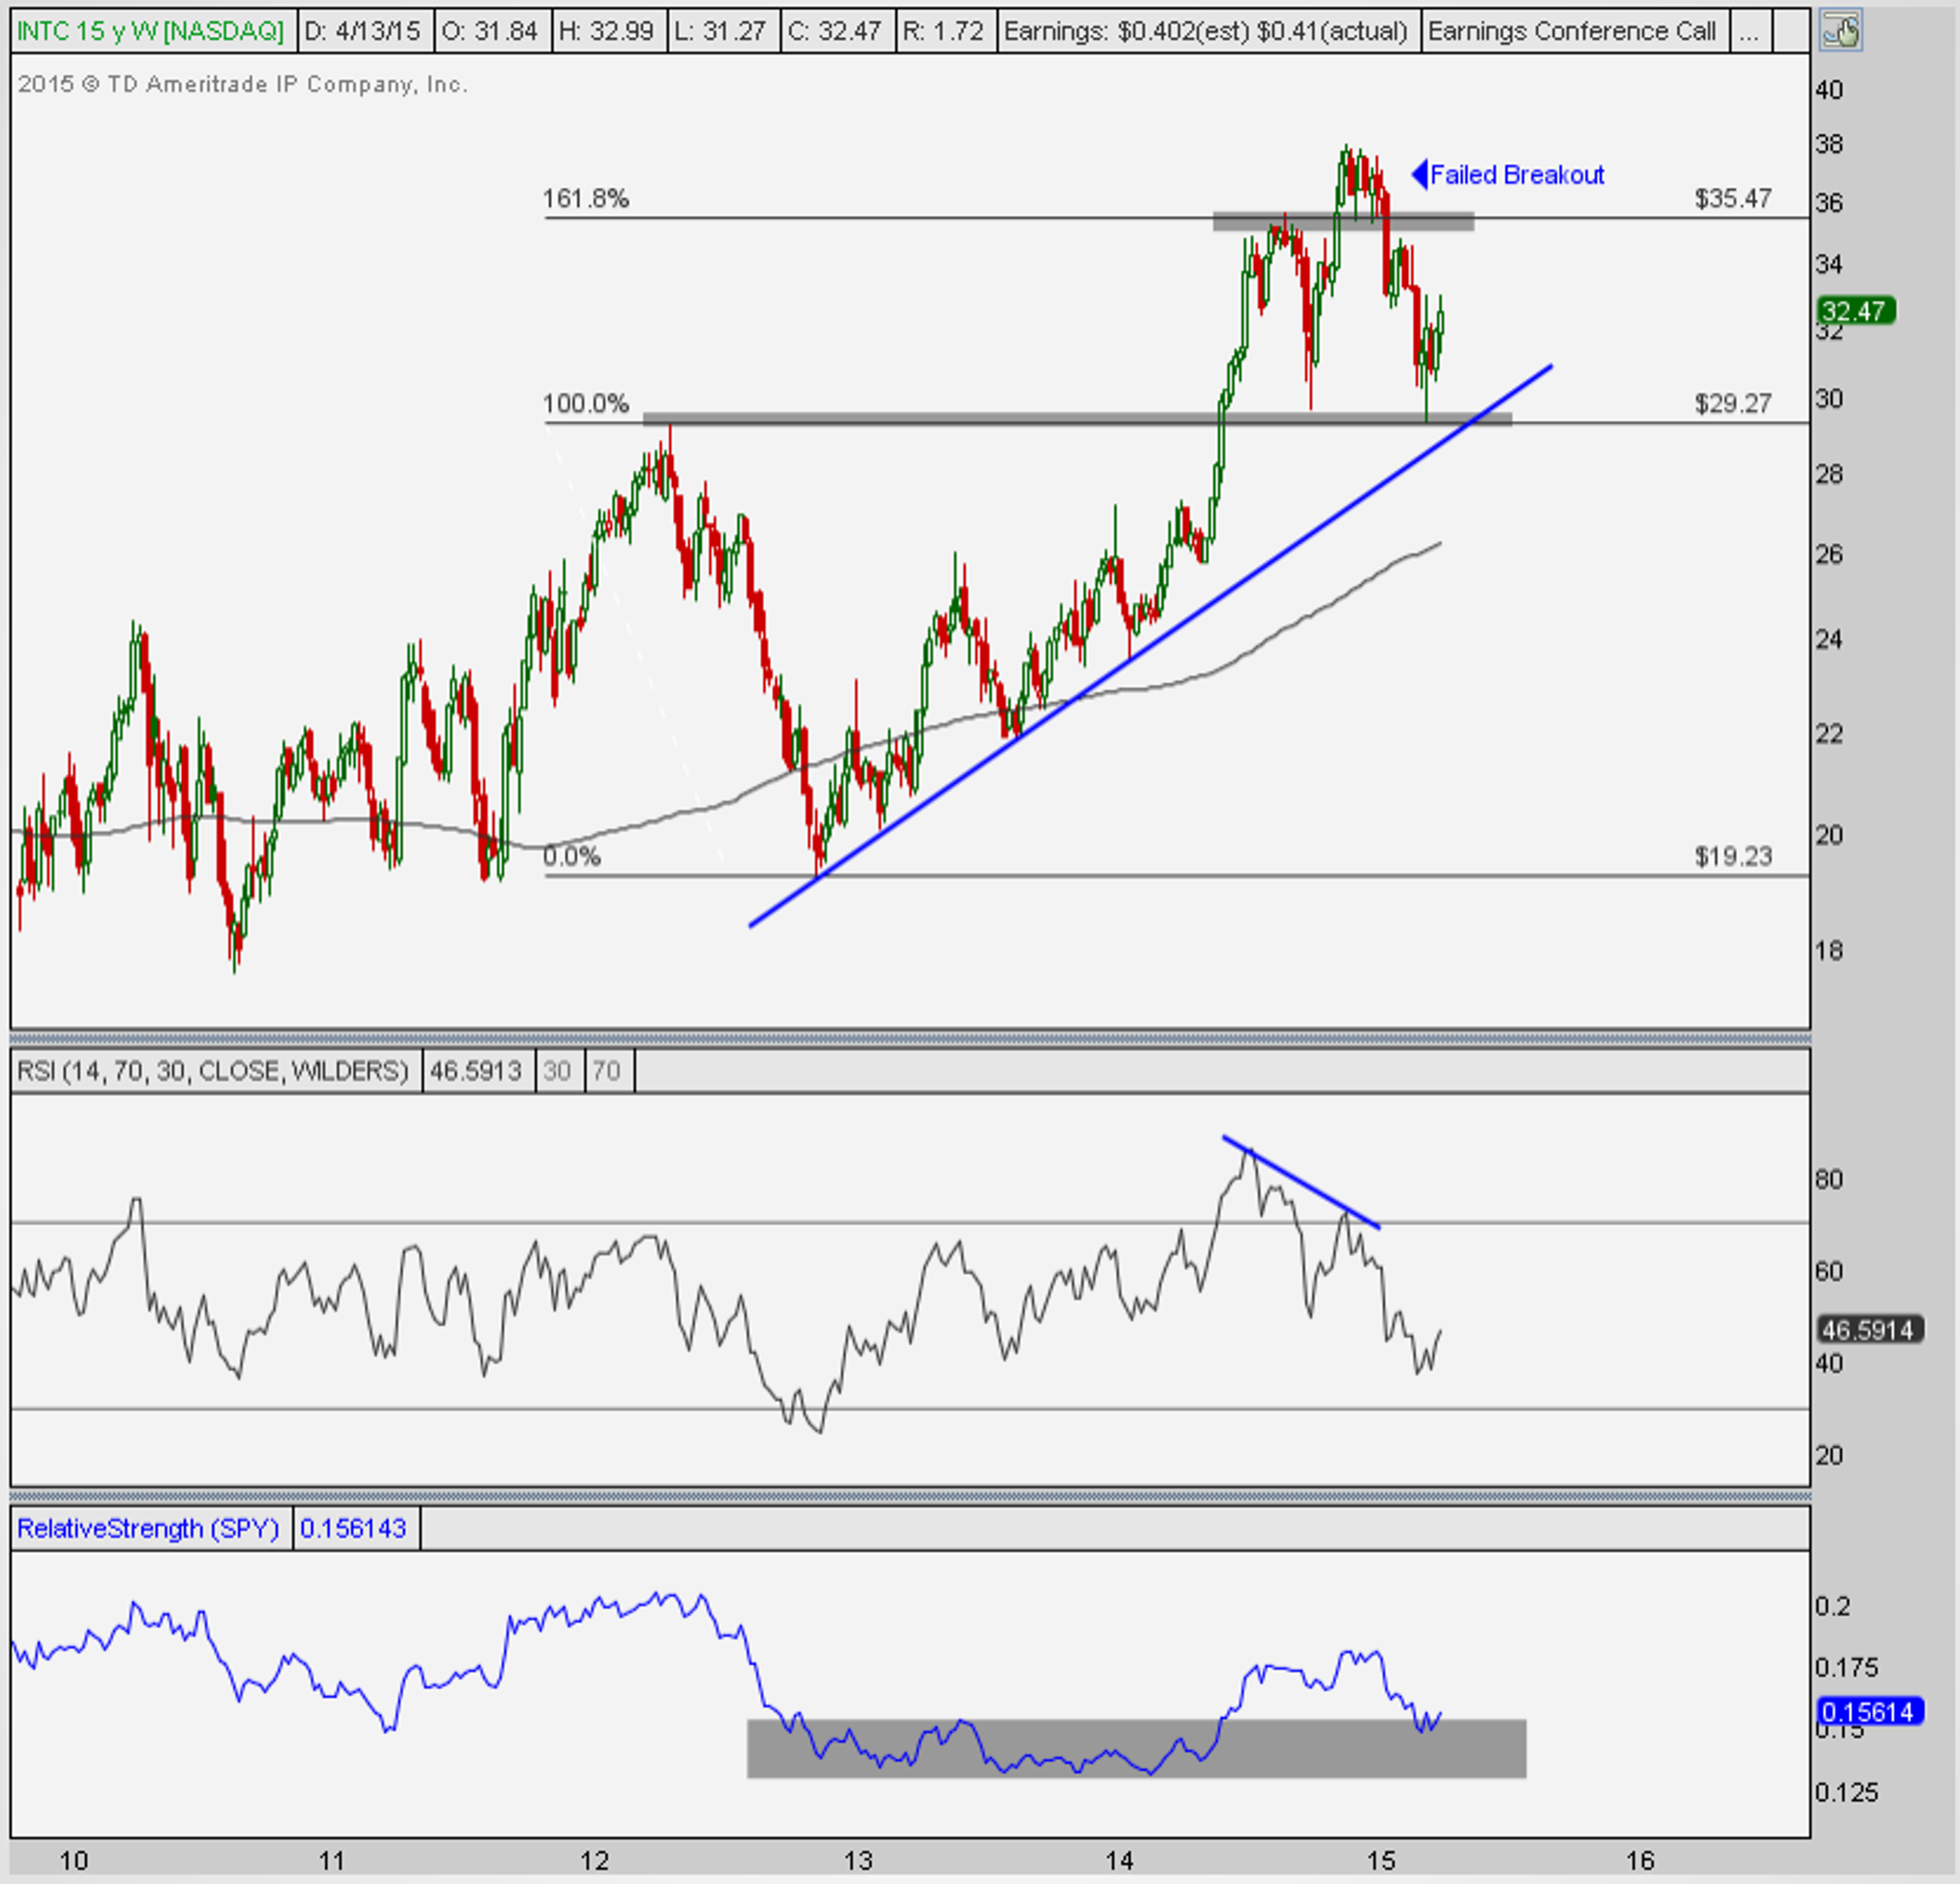
The expert explains that, structurally, Intel “confirmed a failed breakout in January and bearish momentum divergence.” The firm had said this was not good and “now relative strength is also back into this range from 2012-2013 that we [the analysts] said had been a bullish breakout.”
Eagle Bay still only wants to be long “above that shaded area near 35.50 and more neutral if below it.” This is still something they therefore would rather approach better from a tactical perspective (see daily chart below).

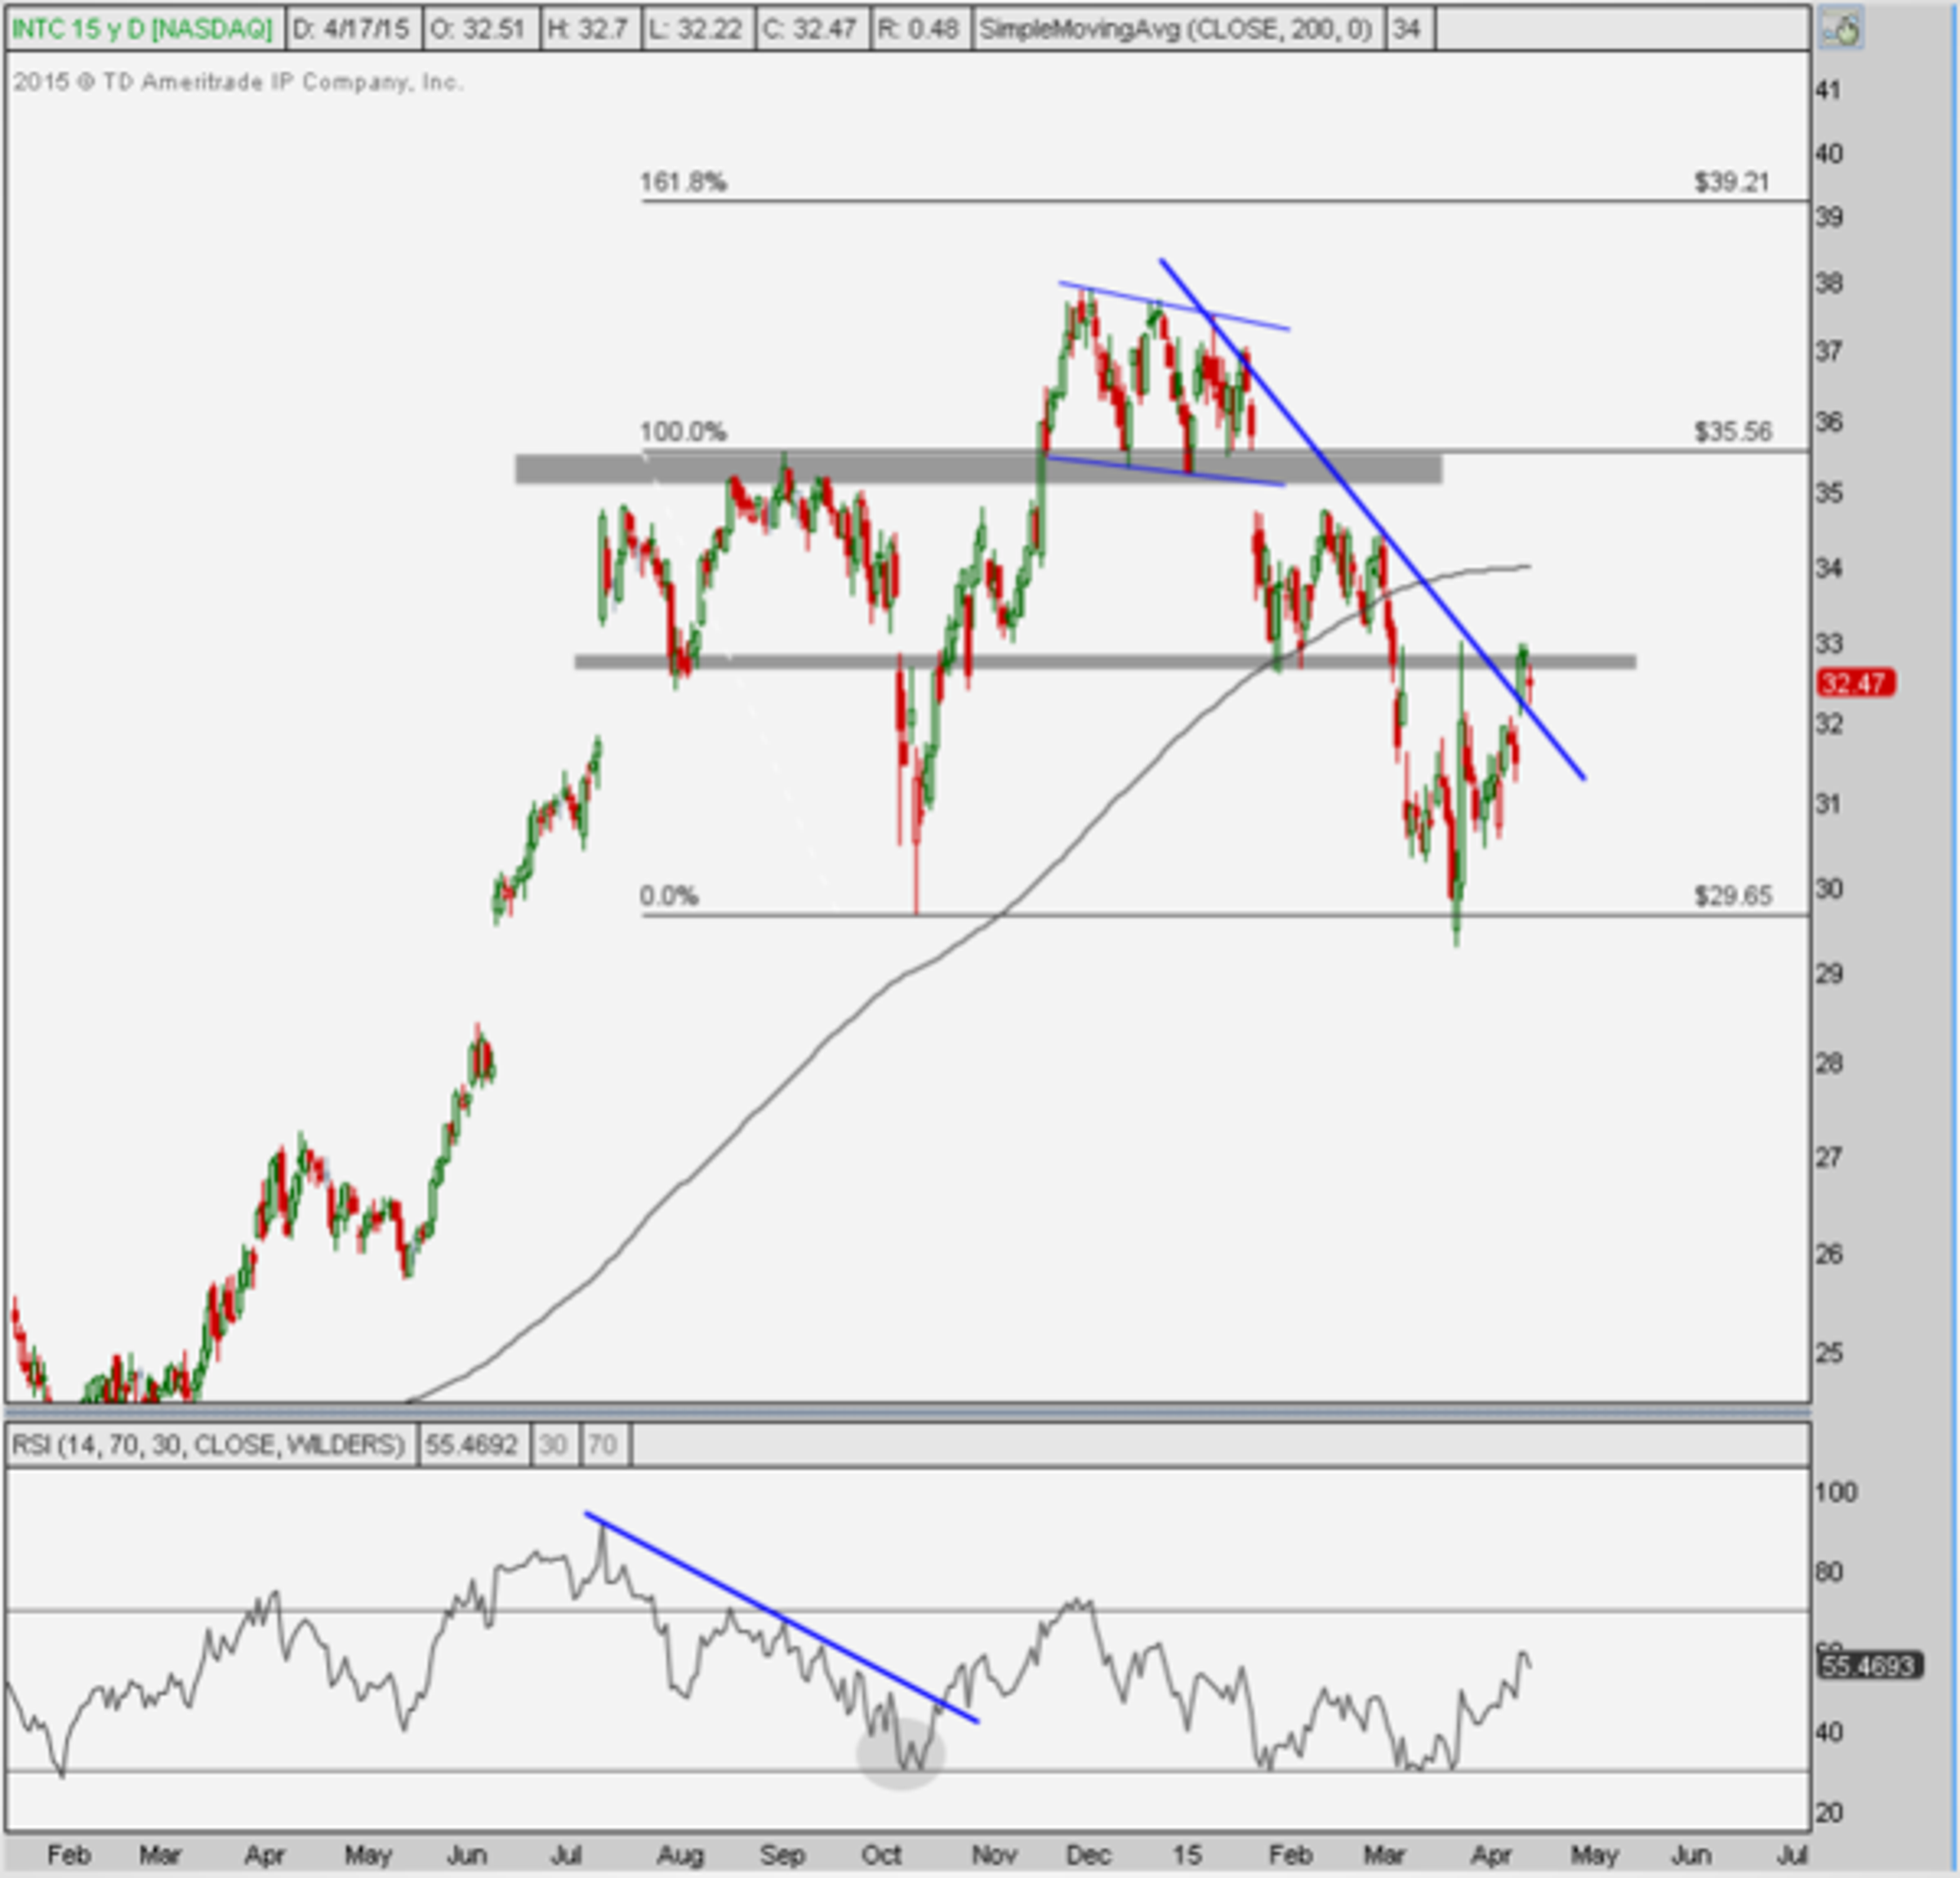
Looking at last Friday’s chart, Parets highlights that he “only wanted to be long above the September highs with a target near 39 and that below that neutral is best.”
He adds: “after failing to hold those levels in late January,” the firm said that “if prices consolidate a bit above the 200 day moving average,” it would start to put longs on. “This did not happen either and now momentum is in a bearish range hitting oversold conditions on this correction.”
Therefore, Parets sees “little to do here with this much overhead supply and would continue to approach this from a neutral perspective.”
Shares of Intel gained 1.69 percent last week, and almost 1 percent on Monday.
© 2024 Benzinga.com. Benzinga does not provide investment advice. All rights reserved.
date | ticker | name | Price Target | Upside/Downside | Recommendation | Firm |
|---|
Trade confidently with insights and alerts from analyst ratings, free reports and breaking news that affects the stocks you care about.

