


The Markets
The S&P 500 is trying, once again, to break out of a base that is now over a year old. It may be the most anticipated breakout ever. While we’ve been waiting, the reasons why it can’t happen have been piling up. You’ve heard them over and over; the same ones mentioned in Wednesday’s Midweek Market Update.
- Inflation
- Recession
- Debt ceiling
- Weak market breadth
But while those arguments bounce back and forth, something contrary is taking place. Individual stocks are front-running the index. Pull up a chart of AMZN, GOOGL, SNOW, UBER, UPST, MU, LRCX, or a number of other stocks and you’ll find the same thing:
— Long periods of mostly sideways price action, below the 200-day moving average, followed by a move higher out of the range.
It’s not limited to one or two groups. Companies of different sizes and in different sectors are participating. And it makes perfect sense.
How can the primary stock market index break out of the range before we see the same action in individual stocks? It can’t.
Now we’re seeing that action in individual stocks. And the indexes are trying to follow.
So once again, forget the arguments about whether it is a bull or bear market. Maybe inflation will continue to be a problem. Maybe the debt ceiling doesn’t get resolved in time. Maybe weak breadth will eventually take the market down.
In the meantime, there have been opportunities to profit on the long side. And since we know trends have a tendency to continue, and since we continue to see more Nasdaq 100 stocks trading above their 200-day MA, not fewer, it makes sense to keep looking for those opportunities.
The late Jon Boorman had a great way of putting it.
Buy uptrends and manage risk.
More in the charts below.
The Charts
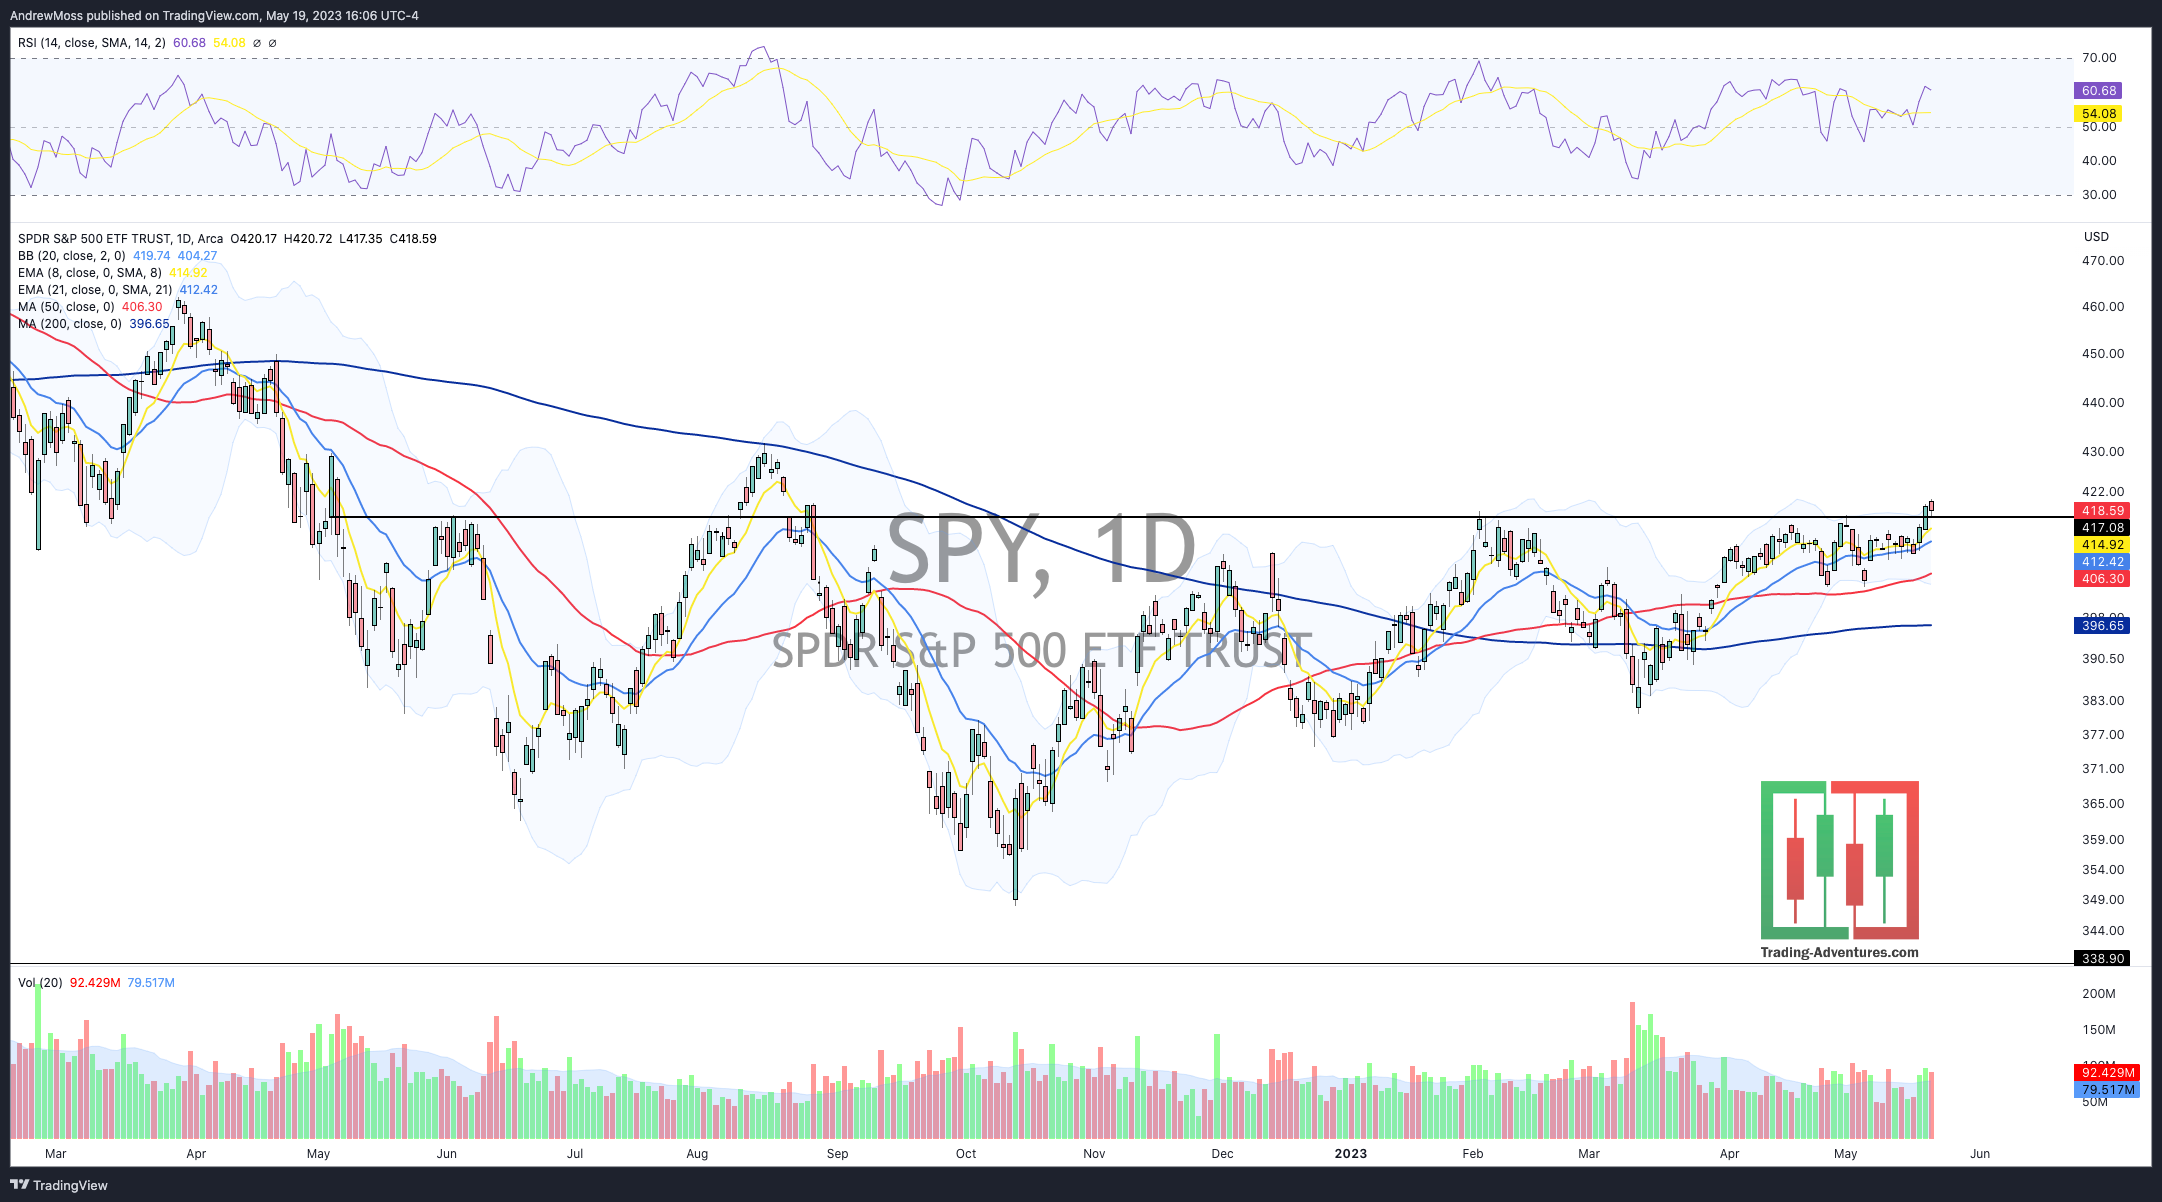
SPY SPY has finally moved above the line. “We’ve seen this before,” you might say. And indeed we have, several times. So the key now is, can it stay above the line this time? For this move to really prove itself we want to see an acceleration above the line followed by a pullback that retests, but stays above.
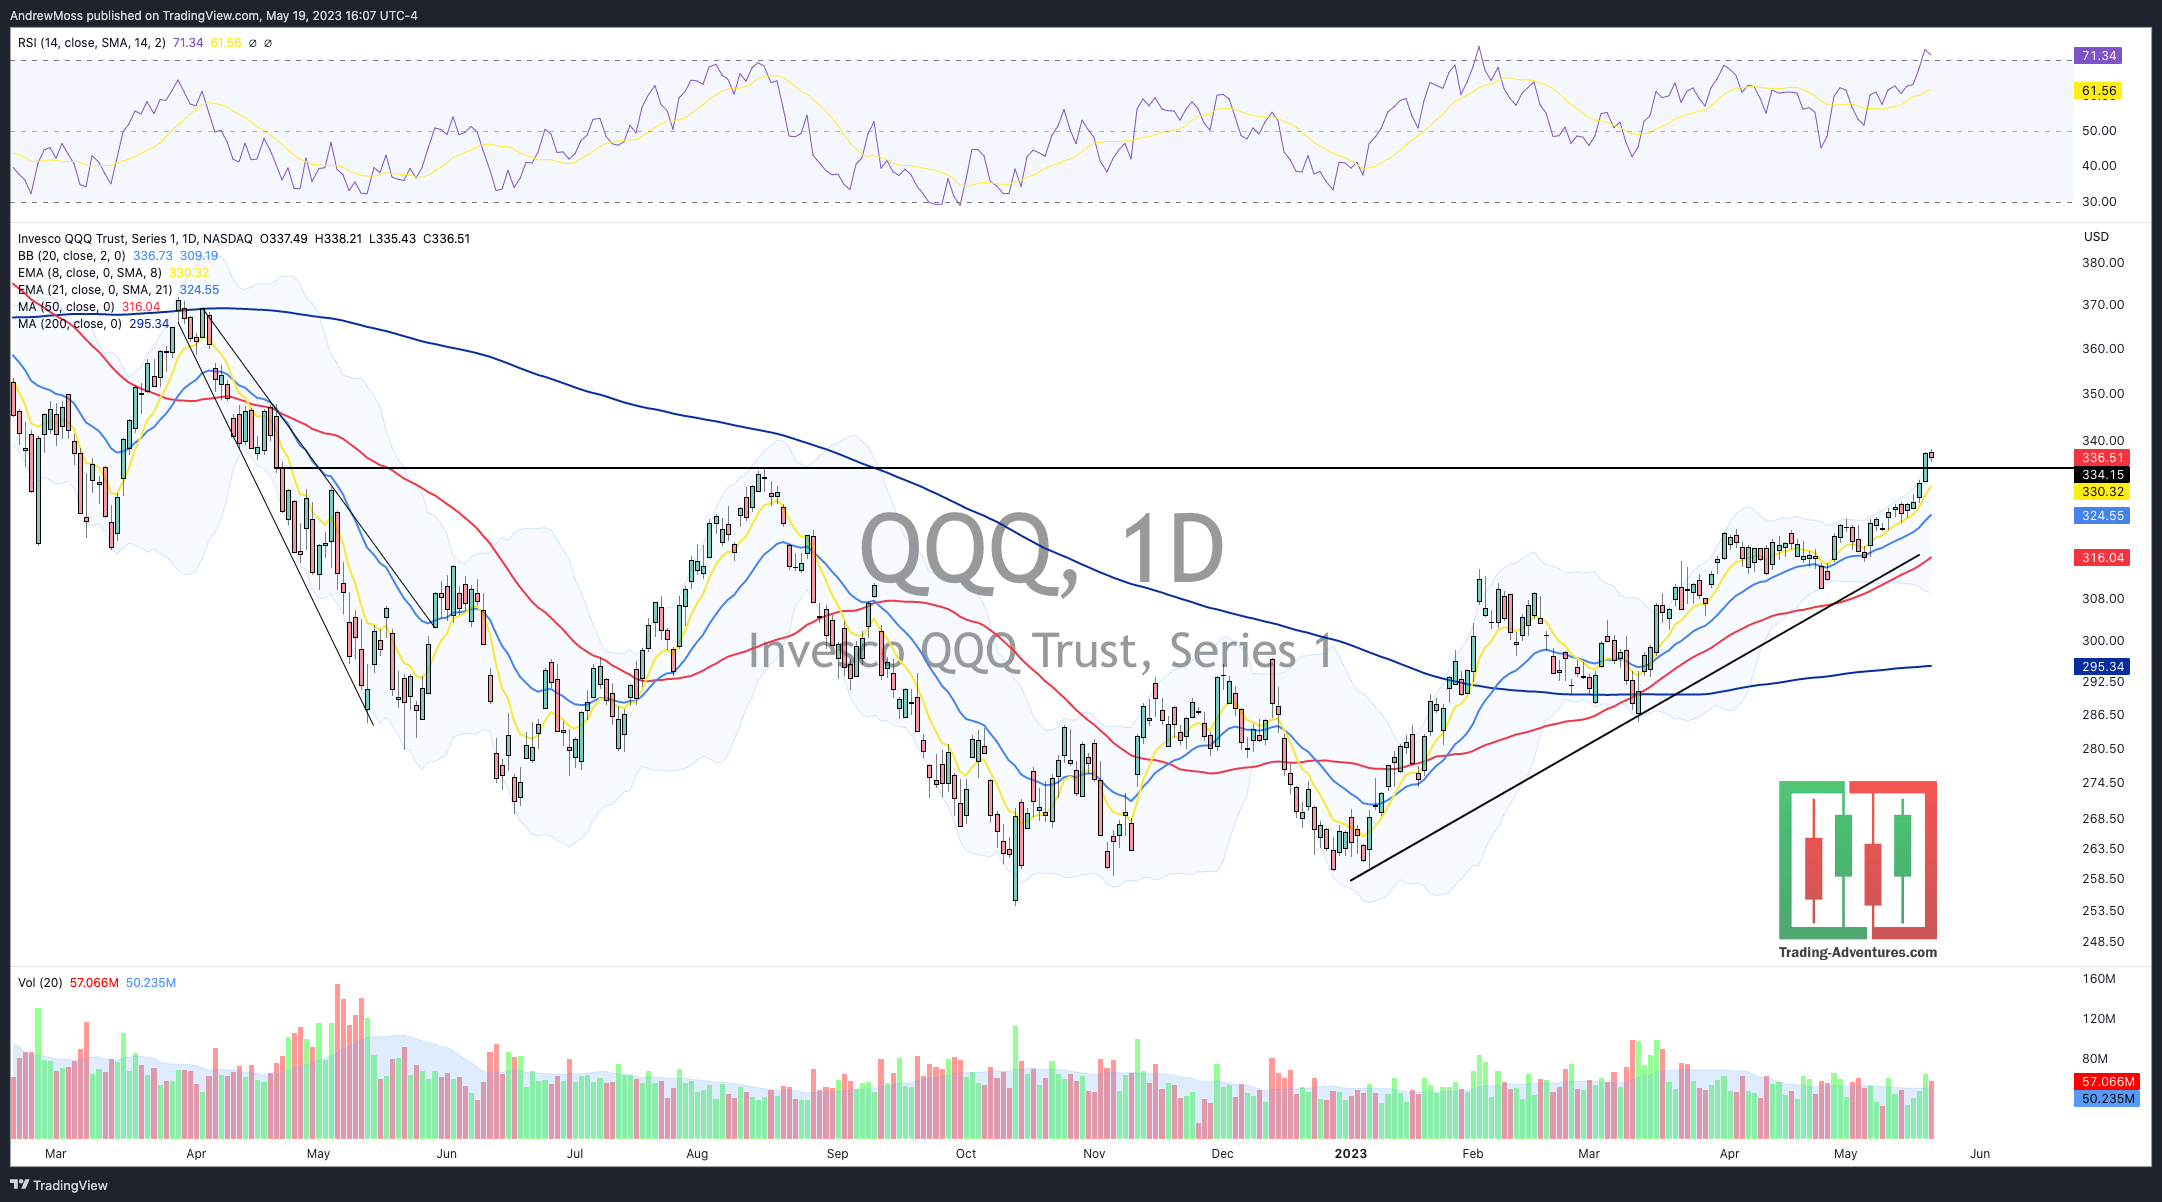
QQQ QQQ continues to be the leader with a very impressive move this week. Now it’s important to be aware of the elevated RSI and the degree of extension above the 8 and 21-day moving averages. Remember, we think of the space between the 8/21 MAs as ‘price equilibrium.’ That’s where price really wants to be.
Like the scenario above, it would be ideal to see QQQ narrow the gap with that equilibrium (either by pulling back to the averages or moving sideways while the averages catch up) and then resume the move higher.
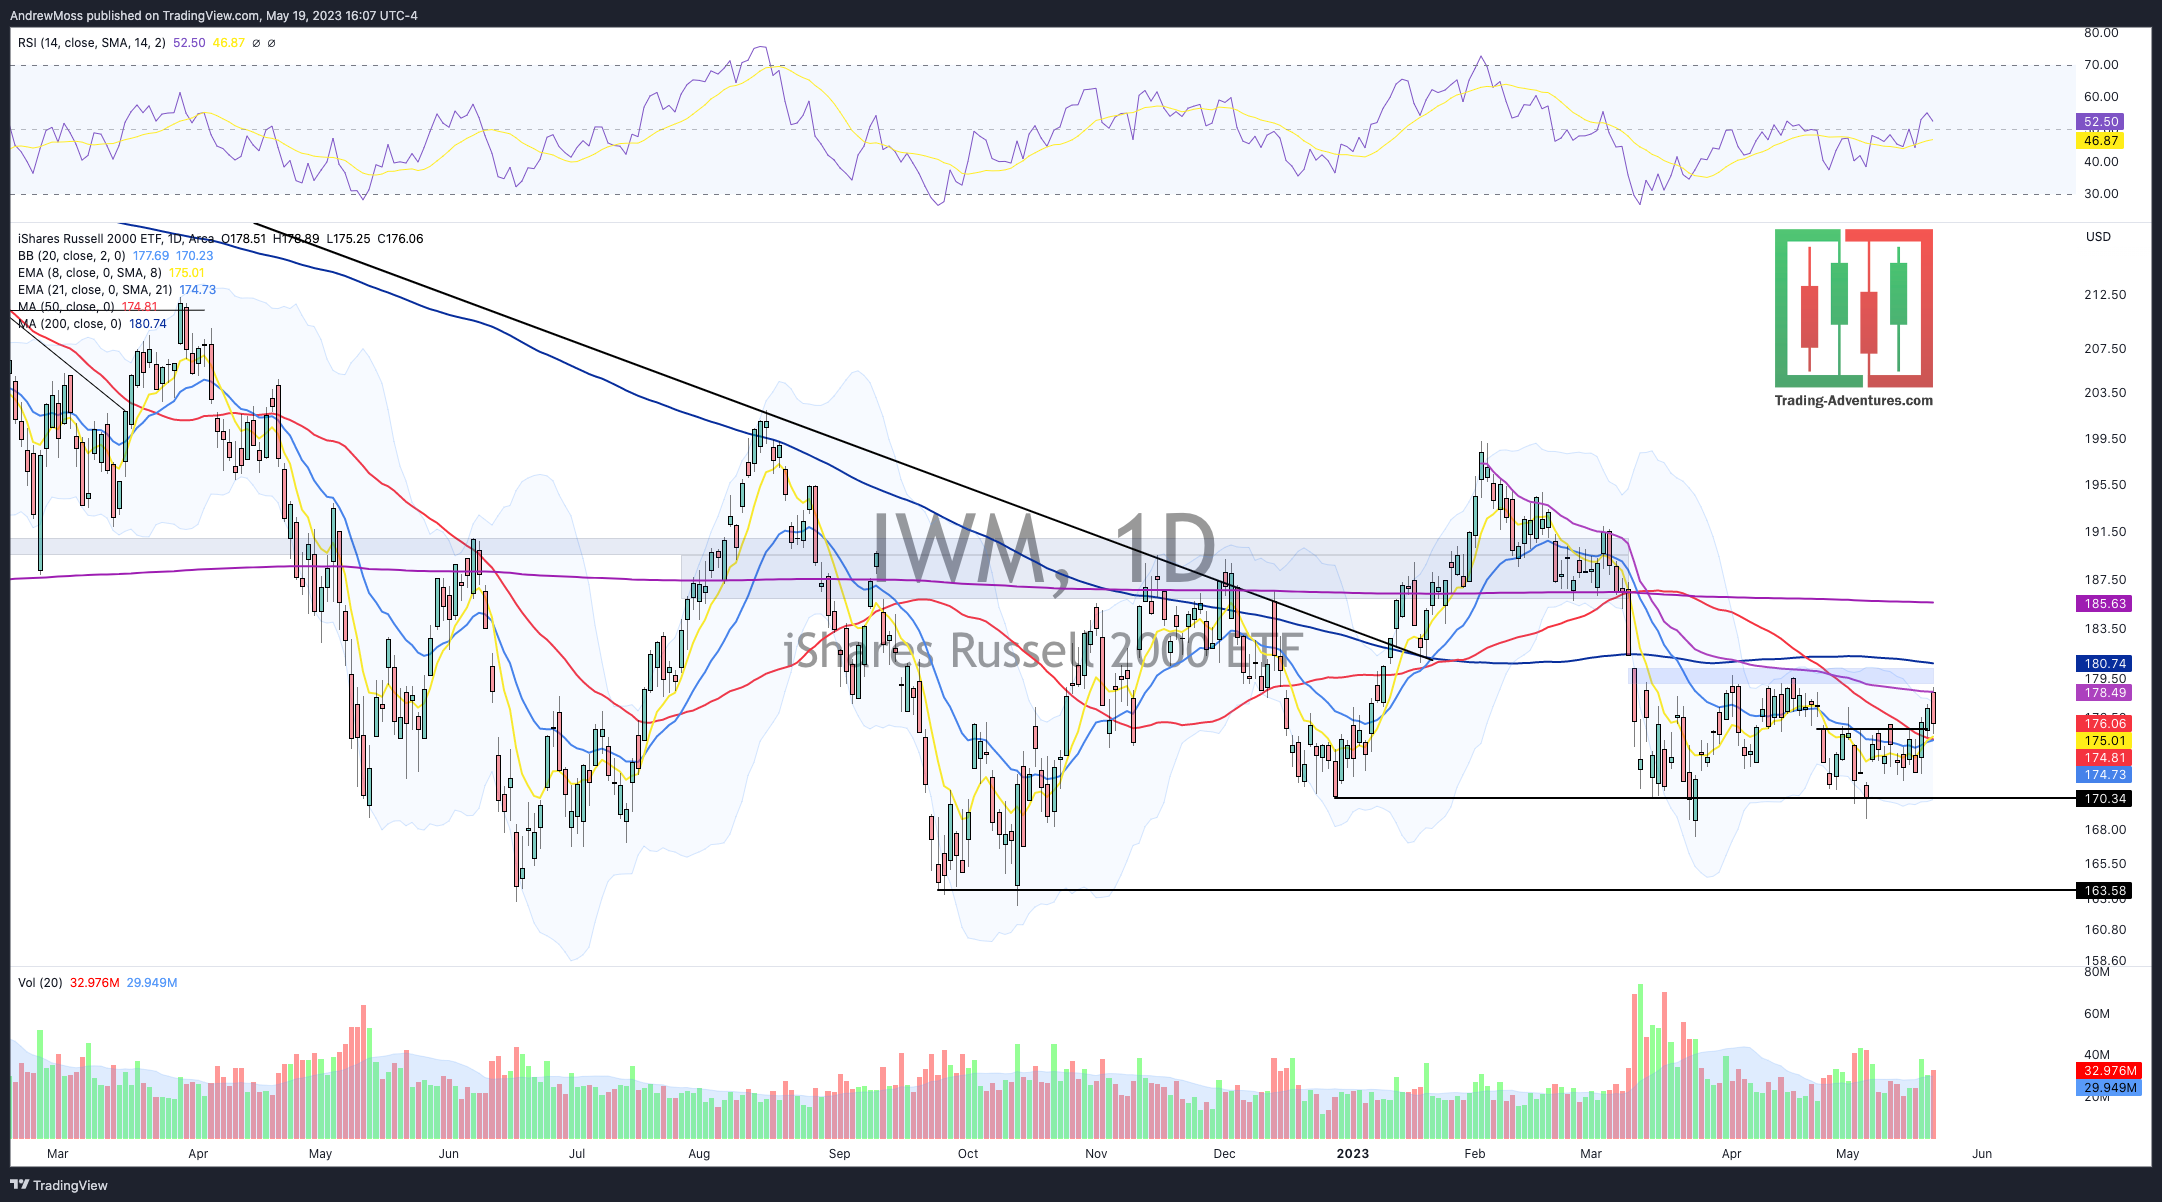
IWM IWM Even the small-caps were trying to get in on the action today moving higher from the recent range. The big red candle isn’t great. But an initial rejection at the swing high anchored VWAP isn’t a surprise either. And so far it’s staying above that lower range with the 8-day crossing above the 21-day, which is about to cross above the 50-day. So the action is constructive.
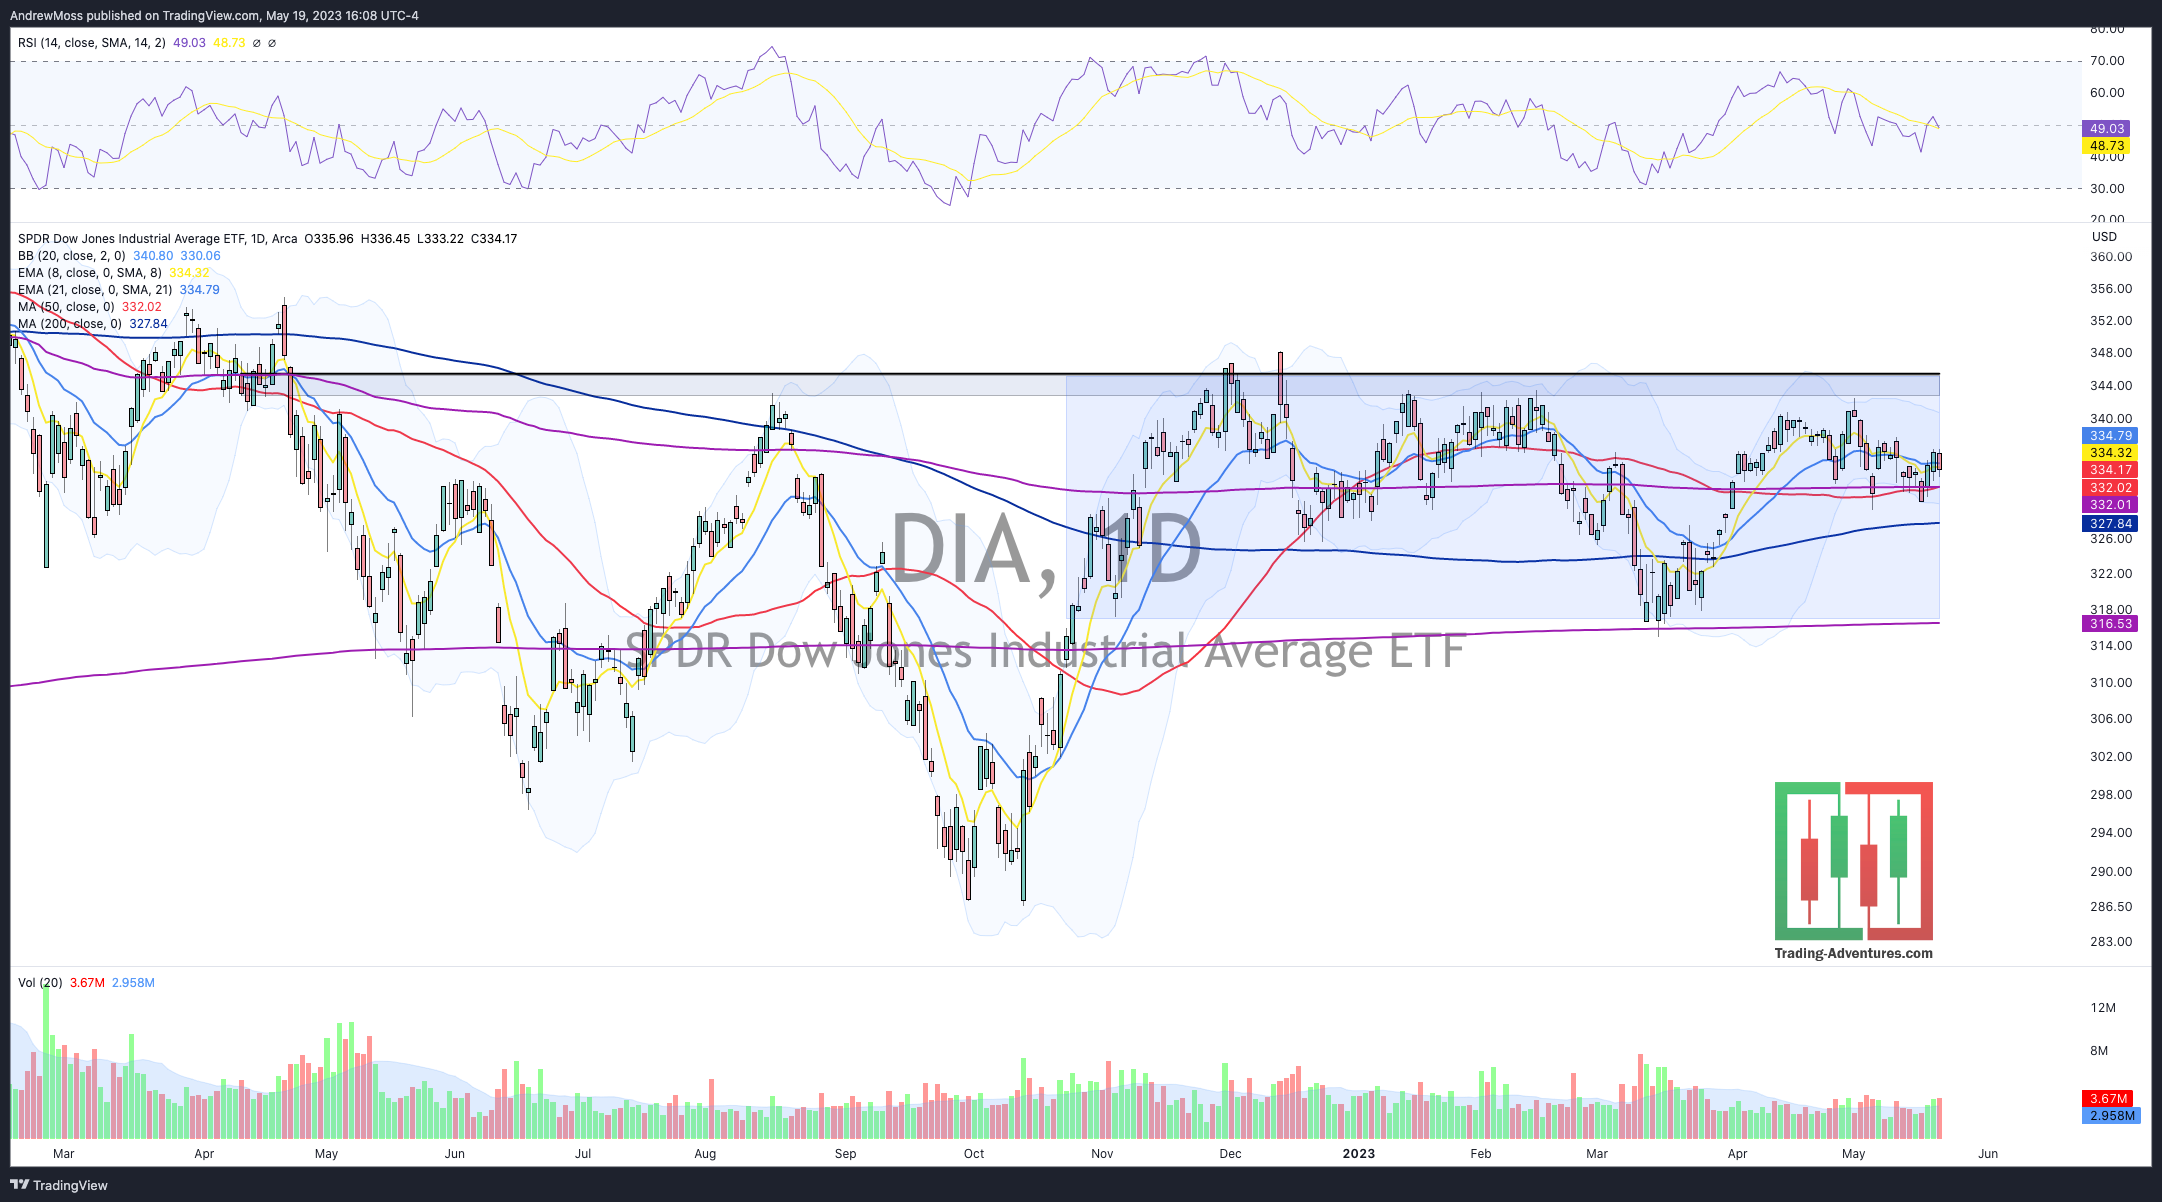
DIA DIA The Dow 30 stocks continue to mosey along the price equilibrium, 8 and 21-day MAs. No big move here, either way, is just fine. If and when tech and QQQ take a rest, we’d like to see buying rotate into this space. That would signal healthy expansion.
The Closing Bell
Find your trades. Whatever your time frame and risk parameters, your opportunities will come in the specific vehicles you trade. There is no need to be overly focused on the stock market indexes unless you only trade the indexes. Then, by all means, focus there.
But if you’re trying to put together a portfolio of stocks, be sure you know what those particular stocks are doing. And try not to get too caught up in all of the noise.
See you tomorrow for Weekend Weekly Charts on Twitter, where I will share some of the big bases mentioned here.
For more of my work please visit Trading-Adventures.com and follow @Andy__Moss on Twitter.
The Disclosures
***This is NOT financial advice. NOT a recommendation to buy, sell, or trade any security. The content presented here is intended for educational purposes only.
Andrew Moss is an associated member of T3 Trading Group, LLC (“T3TG”) a SEC registered broker/dealer and member of FINRA/SIPC. All trades placed by Mr. Moss are done through T3TG.
Statements in this article represent the opinions of that person only and do not necessarily reflect the opinions of T3TG or any other person associated with T3TG.
It is possible that Mr. Moss may hold an investment position (or may be contemplating holding an investment position) that is inconsistent with the information provided or the opinion being expressed. This may reflect the financial or other circumstances of the individual or it may reflect some other consideration. Readers of this article should take this into account when evaluating the information provided or the opinions being expressed.
All investments are subject to the risk of loss, which you should consider in making any investment decisions. Readers of this article should consult with their financial advisors, attorneys, accountants, or other qualified investors prior to making any investment decision.
POSITION DISCLOSURE
May 19, 2023, 4:00 PM
Long: GOOGL, IWM0602C178, META, SQQQ0602C27, TOST, TSLA, TSLA0526C180, UVIX
Short:
Options symbols are denoted as follows:
Ticker, Date, Call/Put, Strike Price
Example: VXX1218C30 = VXX 12/18 Call with a $30 strike
© 2024 Benzinga.com. Benzinga does not provide investment advice. All rights reserved.
Trade confidently with insights and alerts from analyst ratings, free reports and breaking news that affects the stocks you care about.

