


It’s no secret that the S&P 500 has been leaving all bears in the dust. How does the recent rate of change measure up to previous bull runs?
After seeing many bull and bear markets over the years, I have never quite seen a slope of this magnitude. Of course, a picture is worth a thousand words, so:
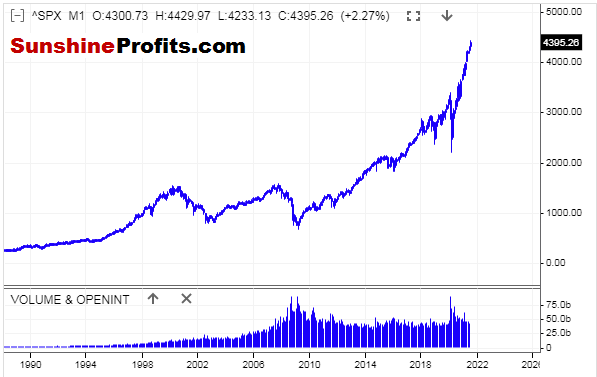
Figure 1 - S&P 500 Index June 1988 - August 2021, Monthly Candles Linear Chart Source stooq.com
The angle of the ascent has dwarfed previous bull markets by far. Of course, there is more than one way to skin a cat. The above chart is a linear chart (most traders, especially short-term traders use linear charts).
However, looking at the recent rally in a logarithmic chart, the ascent does not seem quite as steep.
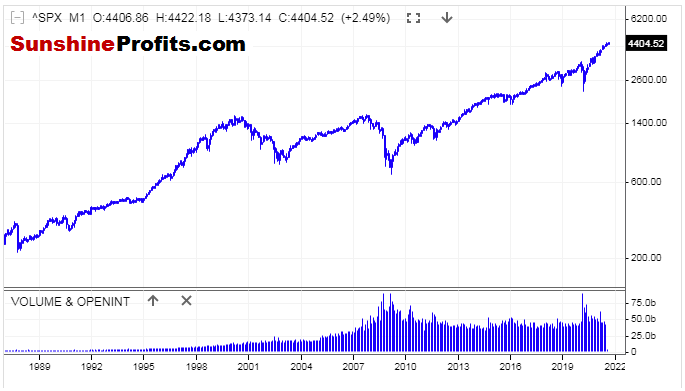
Figure 2 - S&P 500 Index June 1988 - August 2021 Monthly Candles Logarithmic Chart Source stooq.com
On a regular (or linear) price chart, each value change is expressed in the same way. This means that a change of $2 to $4 looks identical to a change of $28 to $30.
On a logarithmic chart, the amount of percentage change is what is treated identically.
Knowing the difference between the two chart types can be beneficial for traders, and keep price moves in perspective. As we can see in the first chart, the upward move in the S&P 500 looks extreme, while shown in the logarithmic price chart, its angle doesn’t look as sharp.
Expressing the runup as a percentage of the S&P 500 since the pandemic lows, we are higher by approximately 103% in eighteen months.
In comparison, I would like to take a look at the runup from the tech bubble selloff in 2002 to the highs that were made in 2007.
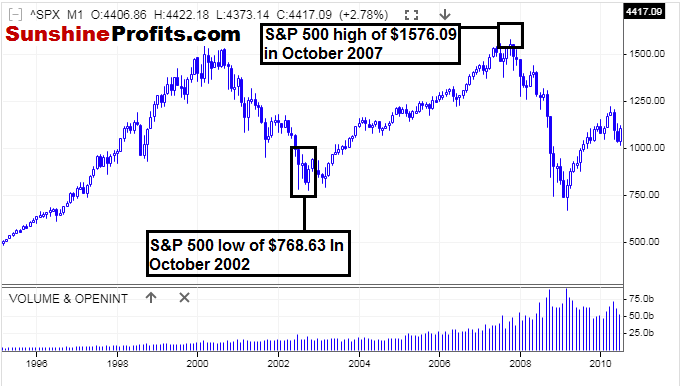
Figure 3 - S&P 500 Index January 1995 - April 2010 Monthly Candles Linear Chart Source stooq.com
From trough to peak (October 2002 - October 2007), it took the S&P 500 five years to move 105%. Let’s keep in mind that the sell-off from the March 2000 peak to the October 2002 lows was over a 2 year and 7-month period.
This is more reminiscent of how bear markets used to be in US equities; there were lower prices over longer time periods.
In comparison, the coronavirus meltdown in 2020 was a two-month affair, and we have now been moving higher for 17 months since the lows. Was the coronavirus meltdown a flash crash or indeed a bear market?
The meltdown was so short-lived and was obviously nothing that we have ever experienced before.
What Do I Emphasize Long Term Charts?
Markets do have memories. In fact, I find that longer-term charts are more valuable than short-term charts in almost all timeframe comparisons. Since we are in uncharted territory in the US stock indices, we could gain some kind of insight into the previous trough to peak bull runs.
In Summary:
From pandemic low to current highs in the S&P 500: 103% in eighteen months
From dotcom low to highs before US Financial Crisis: 105% in five years
It can be challenging to get a read on where the US equity markets are trading as a whole these days, given that there is no more chart resistance. In addition, market participants are now accustomed to higher highs, and every dip seems like it is bought more quickly than the last. Although using comparisons like this will not provide insight into exact entry and exit levels, such analysis can provide some long-term comparisons in an otherwise incomparable market. I do hope you find value in this perspective.
Thank you.
Rafael Zorabedian Stock Trading Strategist
Sunshine Profits: Effective Investment through Diligence & Care
* * * * *
This content is for informational and analytical purposes only. All essays, research, and information found above represent analyses and opinions of Rafael Zorabedian, and Sunshine Profits' associates only. As such, it may prove wrong and be subject to change without notice. You should not construe any such information or other material as investment, financial, or other advice. Nothing contained in this article constitutes a recommendation, endorsement to buy or sell any security or futures contract. Any references to any particular securities or futures contracts are for example and informational purposes only. Seek a licensed professional for investment advice. Opinions and analyses were based on data available to authors of respective essays at the time of writing. Information is from sources believed to be reliable; but its accuracy, completeness, and interpretation are not guaranteed. Although the information provided above is based on careful research and sources that are believed to be accurate, Rafael Zorabedian, and his associates do not guarantee the accuracy or thoroughness of the data or information reported. Mr. Zorabedian is not a Registered Investment Advisor. By reading Rafael Zorabedian’s reports, you fully agree that he will not be held responsible or liable for any decisions you make regarding any information provided in these reports. Trading, including technical trading, is speculative and high-risk. There is a substantial risk of loss involved in trading, and it is not suitable for everyone. Futures, foreign currency and options trading contains substantial risk and is not for every investor. An investor could potentially lose all or more than the initial investment when trading futures, foreign currencies, margined securities, shorting securities, and trading options. Risk capital is money that can be lost without jeopardizing one’s financial security or lifestyle. Only risk capital should be used for trading and only those with sufficient risk capital should consider trading. Rafael Zorabedian, Sunshine Profits' employees, affiliates, as well as members of their families may have a short or long position in any securities, futures contracts, options or other financial instruments including those mentioned in any of the reports or essays, and may make additional purchases and/or sales of those securities without notice. Past performance is not indicative of future results. There is a risk of loss in trading.
© 2024 Benzinga.com. Benzinga does not provide investment advice. All rights reserved.
Trade confidently with insights and alerts from analyst ratings, free reports and breaking news that affects the stocks you care about.

