


It was a thunderous day for equity indices yesterday, with the S&P 500 approaching all-time highs. Our analysis has worked well. What comes next for the benchmark US index?
Greetings! What a move in the $SPX from its 50-day moving average touched on Friday and Monday. In fact, the S&P 500 had its best two days since May 14th!
We heard from Chair Powell yesterday during his testimony at the House of Representatives. It was a politically fueled discussion, with Republicans highlighting the lack of desire of many workers to return to work in some states. The market moved higher off the testimony, with Chair Powell reiterating that inflation was indeed transitory and very sector-specific. Is this correct? I suppose time will tell. What matters for us is that the broader markets moved higher during and after the testimony; while beginning to retreat in the final 30 minutes of the NY session.
If you have been following along or are a Premium subscriber, you know that we had been waiting for an entry into the S&P 500 at or near the 50-day simple moving average for quite some time. After waiting with patience and discipline, we got our signal on Friday and Monday with the $SPX briefly trading below this key level and ultimately reversing to the upside on Monday.
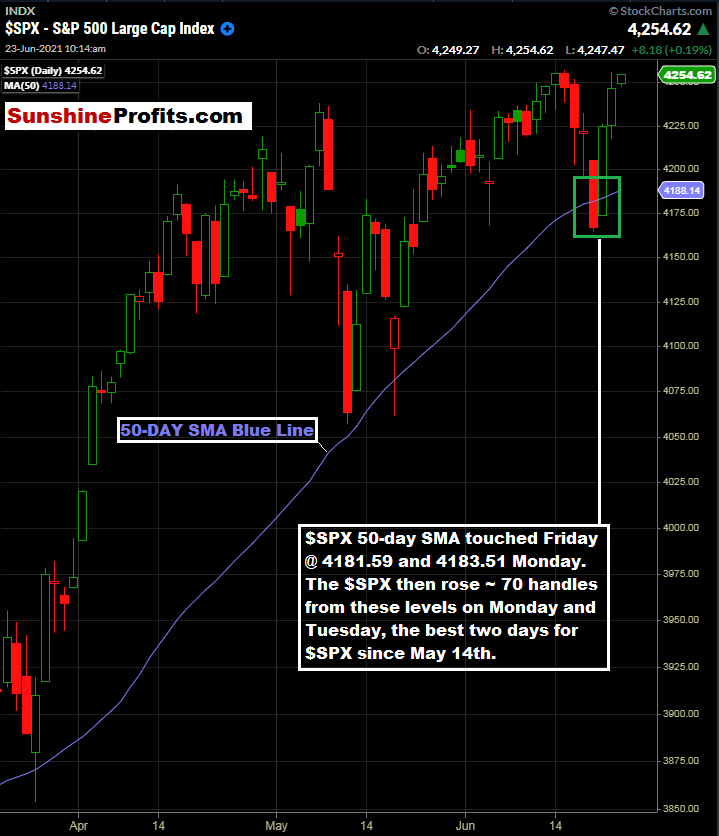
Figure 1 - S&P 500 Index March 19, 2021 - June 23, 2021, Daily Candles Source stockcharts.com
What a wonderful move for us. It takes patience and discipline to wait and execute. Now, if you are a Premium subscriber , you received an email alert at approximately 3:38 ET yesterday, suggesting to consider exiting long S&P 500 positions. There were several reasons for this:
- I realized this was the best two-day period in five weeks.
- Hourly RSI(14) was approaching the 70 level - indicating short-term overbought conditions.
- Being greedy is never a good thing.
- S&P 500 was within 10 handles of all-time highs.
So, around 3:30 PM ET yesterday, all of this came together in my mind and indicated that it may be a good time to sell. What if it keeps going up? Who cares. Nobody catches exact tops and bottoms in trading. The idea is to catch the meat of the move before the market takes it away. And with everything going on including inflation, higher rate environment digestion, and numerous other factors, it was a good time to take chips off the table.
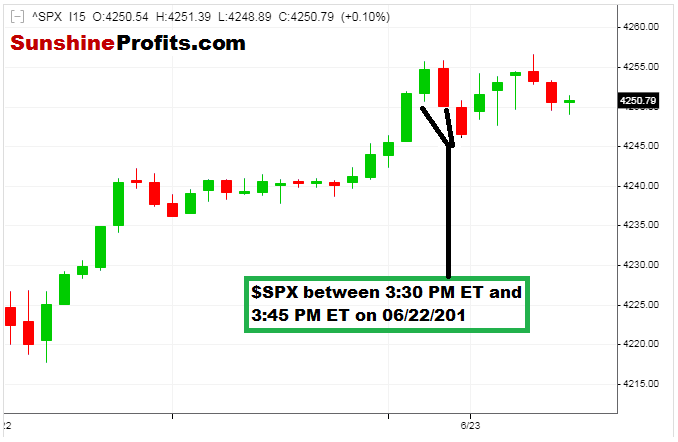
Figure 2 - S&P 500 Index June 22, 2021 - June 23, 2021, 10:58 AM, 15 Minute Candles Source stooq.com
I have been in and around the S&P 500 long enough to know when the index throws you a bone; you take it.
In addition, trading the $SPX around and near all-time highs can be tricky business. What would be the catalyst to break out above the old high? This morning, we got a mixed bag of mostly bearish economic data including New Home Sales, and PMI metrics. Courtesy of our friends at FX Empire :
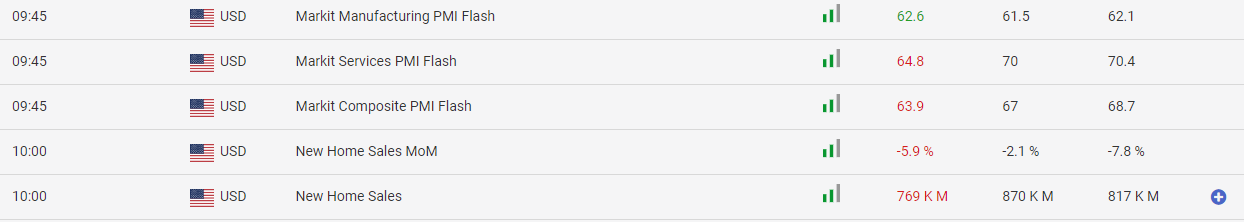
Figure 3 - Certain US Economic Data Releases for June 23, 2021 Source fxempire.com
As we can see from the above table, this morning's economic data was nothing to write home about. However, markets can remain illogical for extended periods. For the moment, my attention turns away from the indices and goes back to select names and themes until more time passes. You have to know when to stay away, too.
Rafael Zorabedian Stock Trading Strategist
Sunshine Profits: Effective Investment through Diligence & Care
© 2024 Benzinga.com. Benzinga does not provide investment advice. All rights reserved.
Trade confidently with insights and alerts from analyst ratings, free reports and breaking news that affects the stocks you care about.

