


GW Pharmaceuticals PLC- ADR GWPH has dipped below $85 for the first time since June and is now on the brink of a technical breakdown. After a huge jump back in March following positive Phase 3 data on Epidiolex, the stock has traded in the bullish channel included on the chart below.

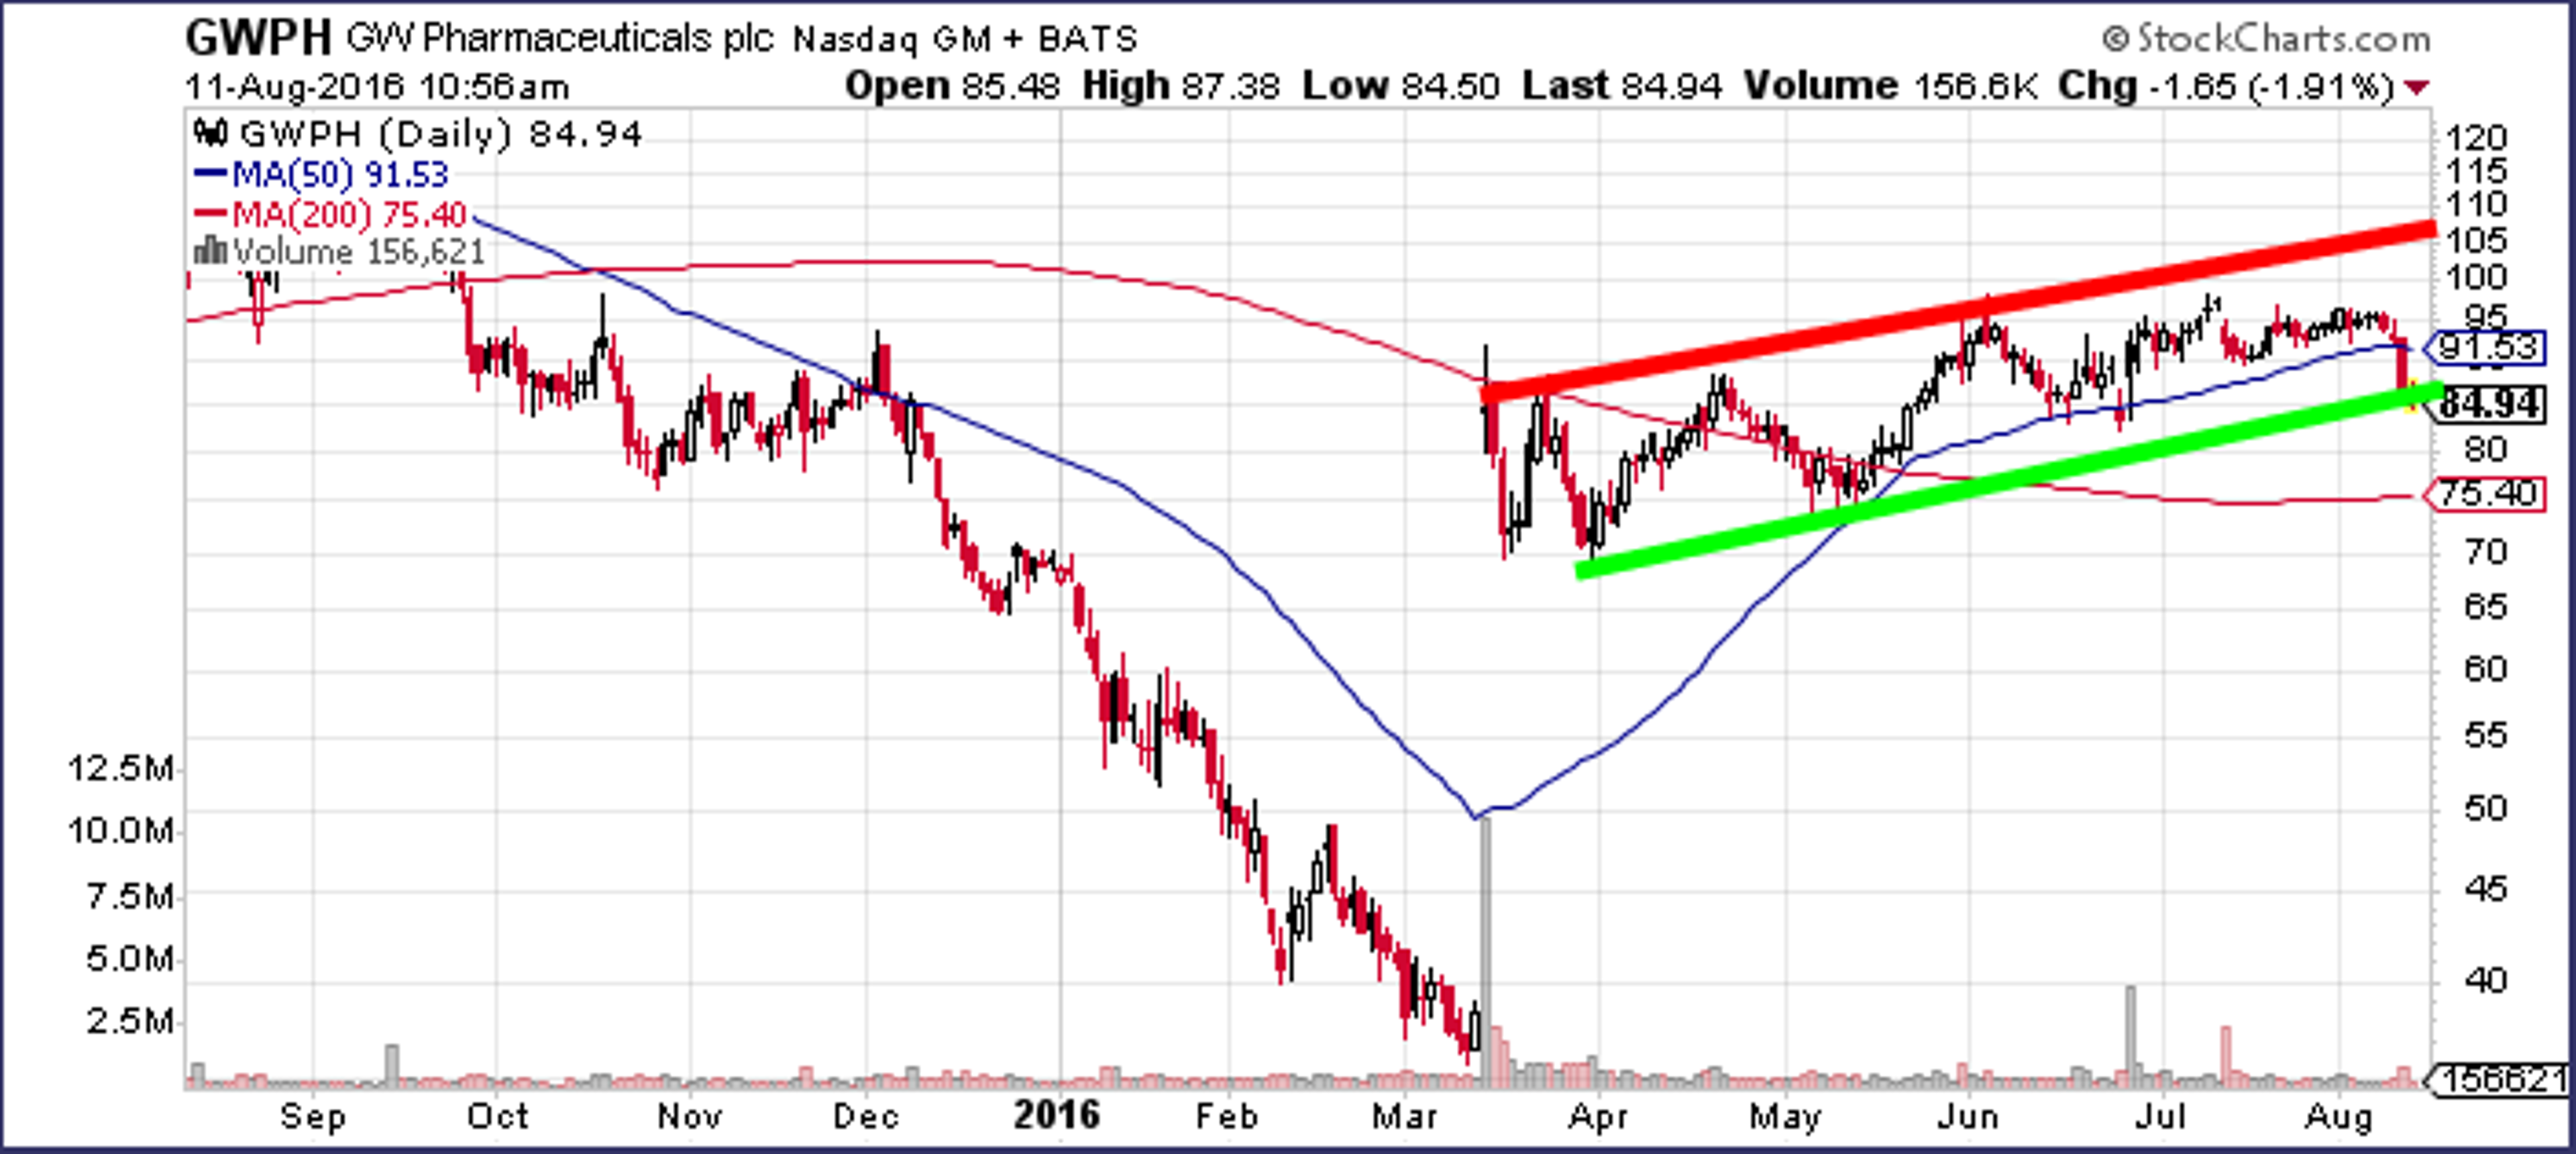
After failing in both June and July to break above $98, however, GW is now up against the bottom of the channel. The stock found support at around the $83 level back in June. But below $83, there is very little technical support down to $70, which represents the stocks post-news low.
Related Link: 4 Factors To Consider During This Year's Dog Days Of Summer
GW’s stock has demonstrated extreme volatility in the past two years, but has made little overall progress. Since the beginning of August 2014, the stock climbed as much as 40 percent within a year. By March 2016, prior to the Phase 3 Epidiolex data, the stock had plummeted from its 2015 high of $133.98 to as low as $35.83.
Despite the positive data, GW has yet to come close to re-testing those $133 highs and has even failed to break back above $100. The stock’s recent dip below $85 is the first time it’s dipped significantly below its 50-day simple moving average since the March news.
© 2024 Benzinga.com. Benzinga does not provide investment advice. All rights reserved.
Trade confidently with insights and alerts from analyst ratings, free reports and breaking news that affects the stocks you care about.

