


PBR’s rectangle
Petróleo Brasileiro S.A. Petrobras operates as an integrated oil and gas company in Brazil and internationally. As of December 31, 2013, the company had proven developed oil and gas reserves of 7,605.8 million barrels of oil equivalent (mmboe) and proven undeveloped reserves of 4,934.5 mmboe in Brazil.
Petrobras was founded in 1953 and is headquartered in Rio de Janeiro, Brazil.
Take a look at the one-year chart of Petroleo Brasileiro Petrobras SA (ADR) PBR below with added notations:

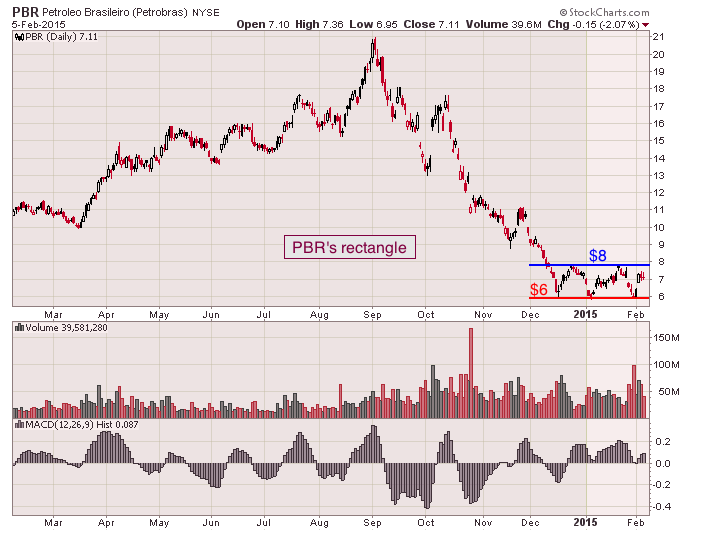
After a consistent decline in December, Petrobras has been trading sideways over the last two months.
During the sideways move, the stock has formed a common pattern known as a rectangle. A minimum of (2) successful tests of the support and (2) successful tests of the resistance will give traders the pattern.
Petrobras' rectangle pattern has formed a resistance just below $8 (blue) and a $6 support (red). At some point, the stock will have to break one of the two levels.
The Tale of the Tape: Petrobras is trading within a rectangle pattern.
The possible long positions on the stock would be either on a pullback to $6 or on a breakout above $8.
The ideal short opportunities would be on either a break below $6 or on a rally back up to $8.
Image credit: Ricardo Stuckart, Wikimedia
© 2024 Benzinga.com. Benzinga does not provide investment advice. All rights reserved.
Trade confidently with insights and alerts from analyst ratings, free reports and breaking news that affects the stocks you care about.

