


The Technical Breakout Trader utilizes multiple time-frame analysis to determine high probability setups in the markets. This strategy can be applied to the major market indices to get a feel for the overall market condition and the future direction. Below is a multiple time-frame analysis of the S&P 500.
Weekly Time-frame Analysis;
Stocks have been on a tear since the early January breakout over 1475 resistance from September 2012 highs. Prices are just below the 2007 highs of 1576 sitting at 1514 ending 2/28/13. Last week the SPX printed a weekly doji candle signaling indecision in the market. The MACD is flattening out and selling volume is picking up indicating a pull back may be near. It's interesting to note the last two pullbacks have found support around the weekly 50 EMA which currently sits at 1414.30.

Daily Time-frame Analysis;
The SPX has been whipping traders up and down looking for direction recently. 1515 was a key resistance level that was broken for 5 trading days before seeing a sell off last Wednesday, 2/20/13 putting it back in its trading range between 1495-1515. The bottom of the range, 1495 was the key support that was compromised on Monday's sell off only to be regained on Tuesday after price found support at the 50 EMA. Today's action was very interesting. The market showed continued strength following yesterdays big gain up until the very last 10 minutes of trading before falling slightly below 1515. 1500 is a significant psychological level to watch as well.

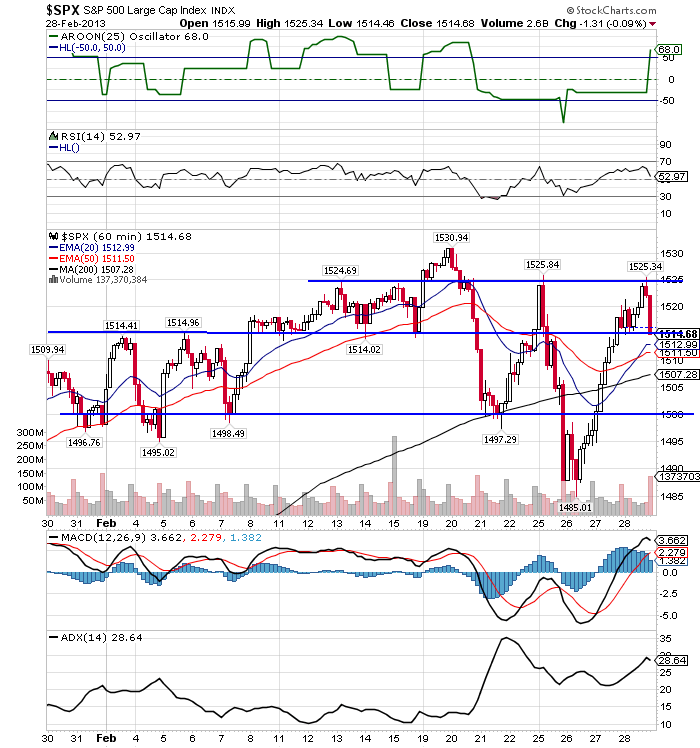
Hourly Time-frame Analysis;
Intra-day market analysis on the hourly time-frame shows todays action as mentioned above. 1525 was rejected at the end of the day, and is a key level to watch to be broken for continued upside in the SPX. The MACD is turning down and RSI pointing south indicates the end of day weakness may continue into tomorrow. If so, I believe 1500 will be tested again.
Conclusion;
We need to see prices retake 1515 and breakout over 1525 for more up side in the rally. If this occurs a test of 2007 highs of 1576 is more likely. However, the weekly chart indicates a pullback is becoming more and more probable. If 1500 is broken again, and both the daily 20 & 50 EMA's break down it would suggest a pull back is happening after all. If so, I would look for support around 1410 the weekly 50 EMA. Until either of these scenarios play out, I expect more choppiness and indecision in the S&P 500.
© 2024 Benzinga.com. Benzinga does not provide investment advice. All rights reserved.
Trade confidently with insights and alerts from analyst ratings, free reports and breaking news that affects the stocks you care about.

