


You guys who know me already understand why it is that I am constantly looking for whipsaws. The best risk vs reward opportunities are sparked from such events. We often refer to whipsaws as failed breakdowns or failed breakouts depending on the direction of the underlying trend. From failed moves come fast moves in the opposite direction, and that’s why we look for them.
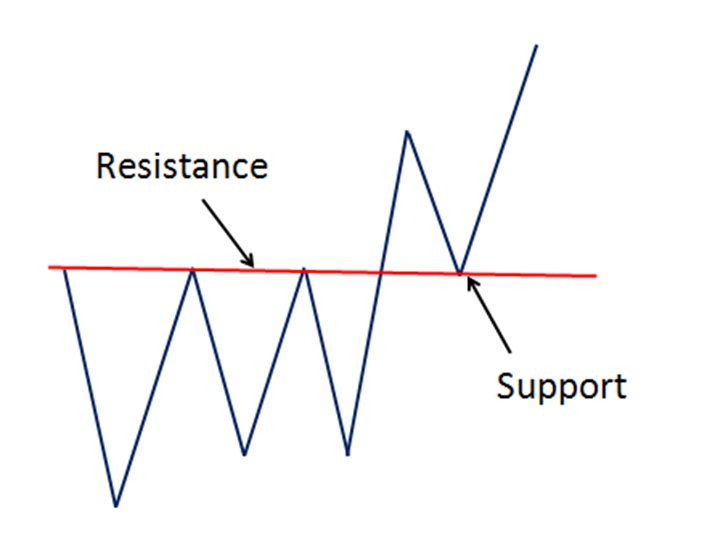
The idea behind support and resistance is that when markets meets resistance, or a level where supply exceeds demand, prices continue to fall from that price until eventually it breaks through it. Sometimes it tests resistance once or twice and sometimes 3 – 4 times, but the idea behind it remains the same. Once resistance has been broken, any sell-offs back to that former resistance should turn into support. This is the principle of polarity. See here:

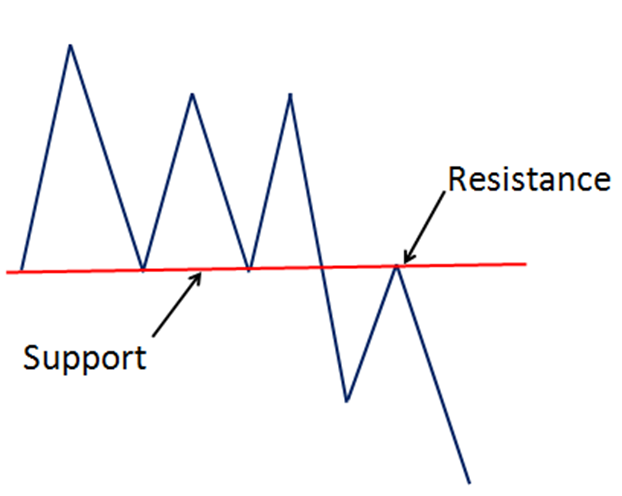
It’s the same thing on the way down. When prices find support, or a level where demand exceeds supply, prices continue to bounce from that price until eventually it breaks through it. Once that occurs, any bounces back to that support level should be met with resistance, more sellers than buyers. See here:

Now, this is where things get interesting. A Whipsaw occurs when a level of support is broken to the downside (or resistance is broken to the upside) and then on the retest of that former support (or resistance), prices break back above it (below in the case of resistance). Here is an example of support being broken and then quickly getting back above:

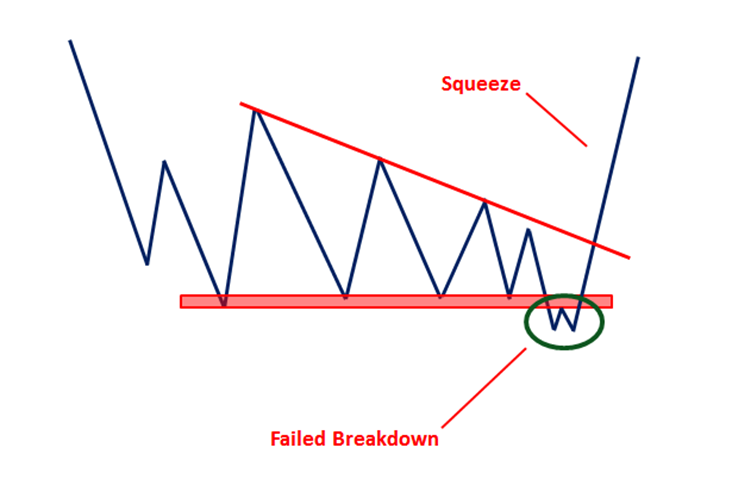
What happens is that all of the shorts that entered on a breakdown to new lows are now wrong. And anyone who had a stop loss below the former support levels got stopped out. The simultaneous unwind of those trades is what causes a squeeze higher. 1) you already have the natural buying taking place sending prices higher 2) all of the shorts need to buy back in order to cover their loss 3) anyone stopped out of their longs is no longer in the trade and therefore needs to buy it to be back in and 4) all of this buying brings in the momentum players that see what’s going on – that’s us.
The entry point is above the former support levels. The exit in case we’re wrong is below the former support levels. So the risk is extremely well-defined, which is what we’re looking for. But more importantly, the potential reward for the amount of risk we’re taking is very much skewed in favor of the bulls, in the case of a squeeze higher. We’re talking 6:1, 8:1 or even over 10:1 reward/risk ratios. We love that.
Crude Oil is now on our watch list for this potential bullish whipsaw. If prices of Crude can get back above the 2009 lows, this is precisely what could be occurring here. In this chart we can see Crude Oil prices hanging out below the 2009 lows over the past 6 weeks. Notice how down below, momentum is putting in a bullish divergence. This is sign #1 that this could be a bullish whipsaw:

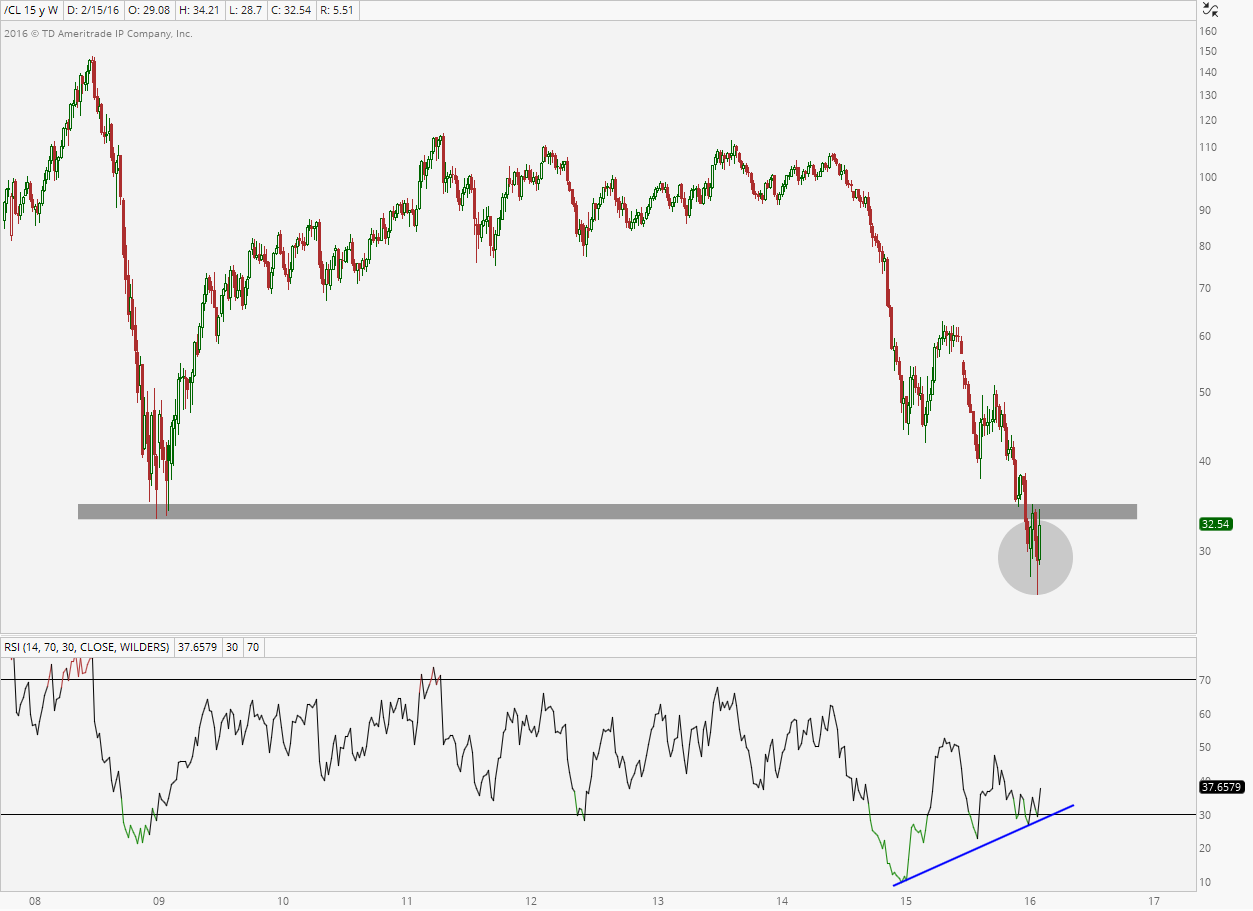
The only thing we need now in order to enter is a rally back above the 2009 lows. This one is very simple. If you think this is a bullish whipsaw and you want to participate, you only want to be long only if prices are above the 2009 lows. If they are below that price then it is either not what we think it might be, or we have yet to see confirmation of it.
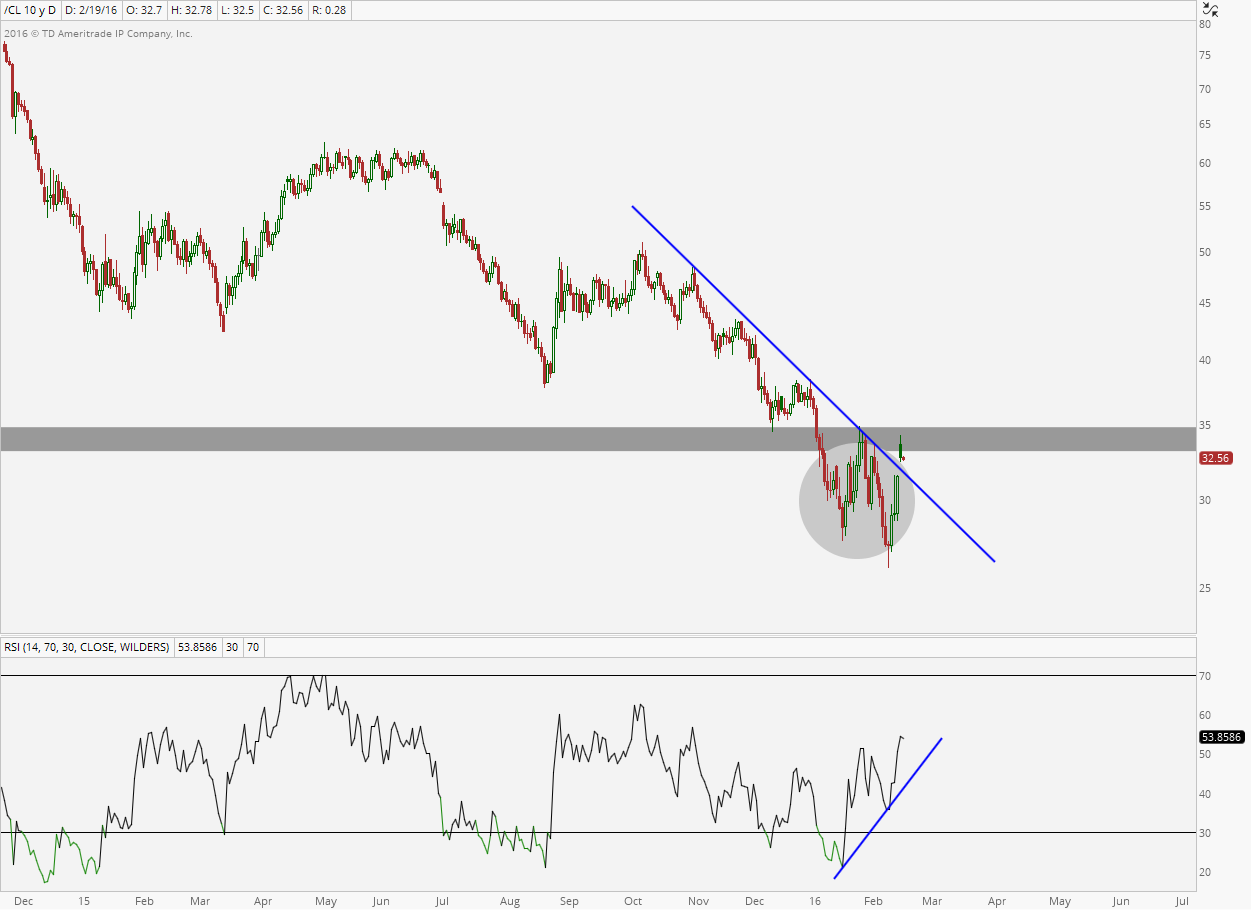
Here is a daily chart showing this potential whipsaw. Again we’re seeing momentum divergence positively on these new lows. If we can get above/stay above the early December lows, we want to be all over Crude Oil. Below that and this one is not what we think it is, or at least not yet.

© 2024 Benzinga.com. Benzinga does not provide investment advice. All rights reserved.
Trade confidently with insights and alerts from analyst ratings, free reports and breaking news that affects the stocks you care about.

