


“Never give up, for that is just the place and time that the tide will turn.” – Harriet Beecher Stowe
A year ago, on February 24, 2014, Zulily Inc ZU reported its first revenue and earnings results since going public in November of 2013. The results exceeded expectations, and the stock price jumped from $42.84 to $72.75 in just three days. After a great start, the stock has been in a free fall since, closing this past Friday at $14.40 -- a drop of 80 percent from its 52-week high.
Whether investors care about this mid-cap e-commerce stock or not, there are many companies like this that have been battered over long and short periods of time. Investors that understand the fundamentals of these companies are formulating a view on the future prospects, and if this represents a good value to purchase the stock (or perhaps short it).
What EidoSearch often hears from investors is their frustration that the price will often move ahead of the fundamental story, or continue to be unappreciated and languish -- in both cases losing out on significant profits. So, for those that like the fundamentals of out-of-favor stocks, how long do they typically languish?
Similar to how investors look at peer companies to gauge how a stock is performing from a relative perspective, EidoSearch uses patterns like price trends to see how peers have reacted to similar trends and environments historically. This allows users to quantify the probable turning points for investors.
Is Now A Good Entry Point For Zulily?
Fundamentally, the company appears to have some decent things going on. In its first full-year earnings release a couple weeks back, the company reported that net sales increased 72 percent to $1.2 billion; it added 4.9 million active customers, representing a 54 percent jump from the previous year.
The next logical question is: "When have we seen peer stocks trade like this historically, and what are the probable outcomes for Zulily?”
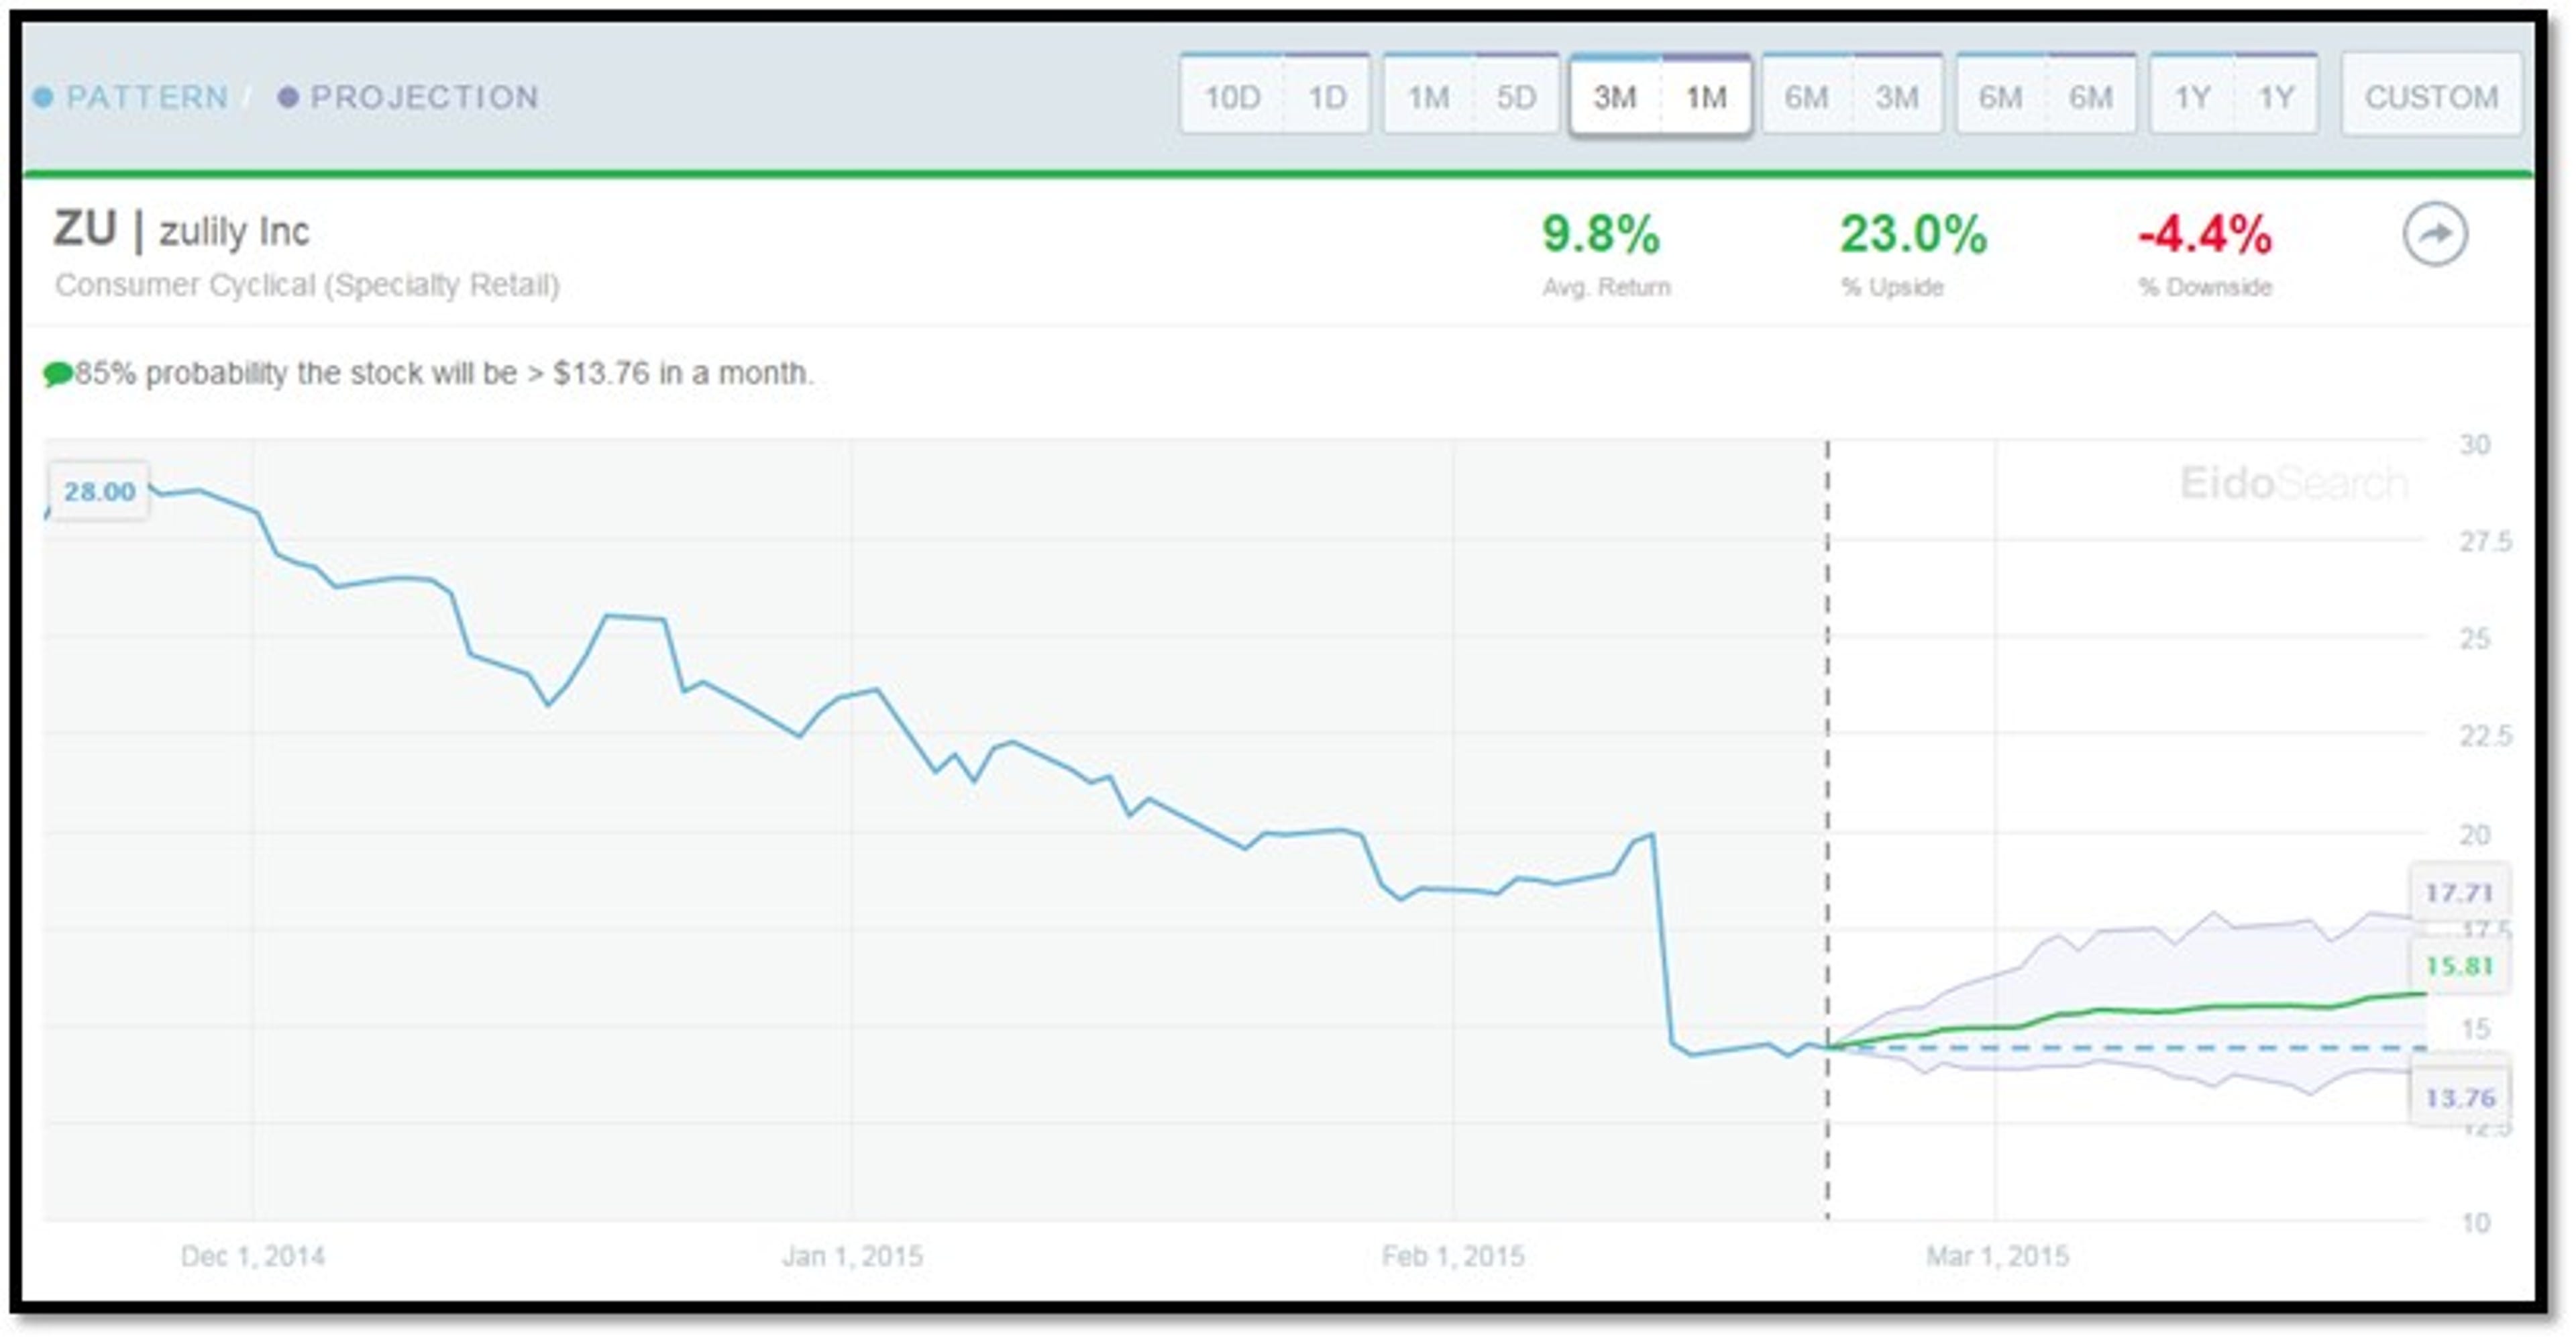
In looking at Zulily, this analysis narrowed the peer group to the Consumer Cyclical Sector, and to just Specialty Retail stocks. It then looked at the stock's current three-month price trend, and also, its one-year price trend, to find the most similar instances of peers that have traded like this historically.
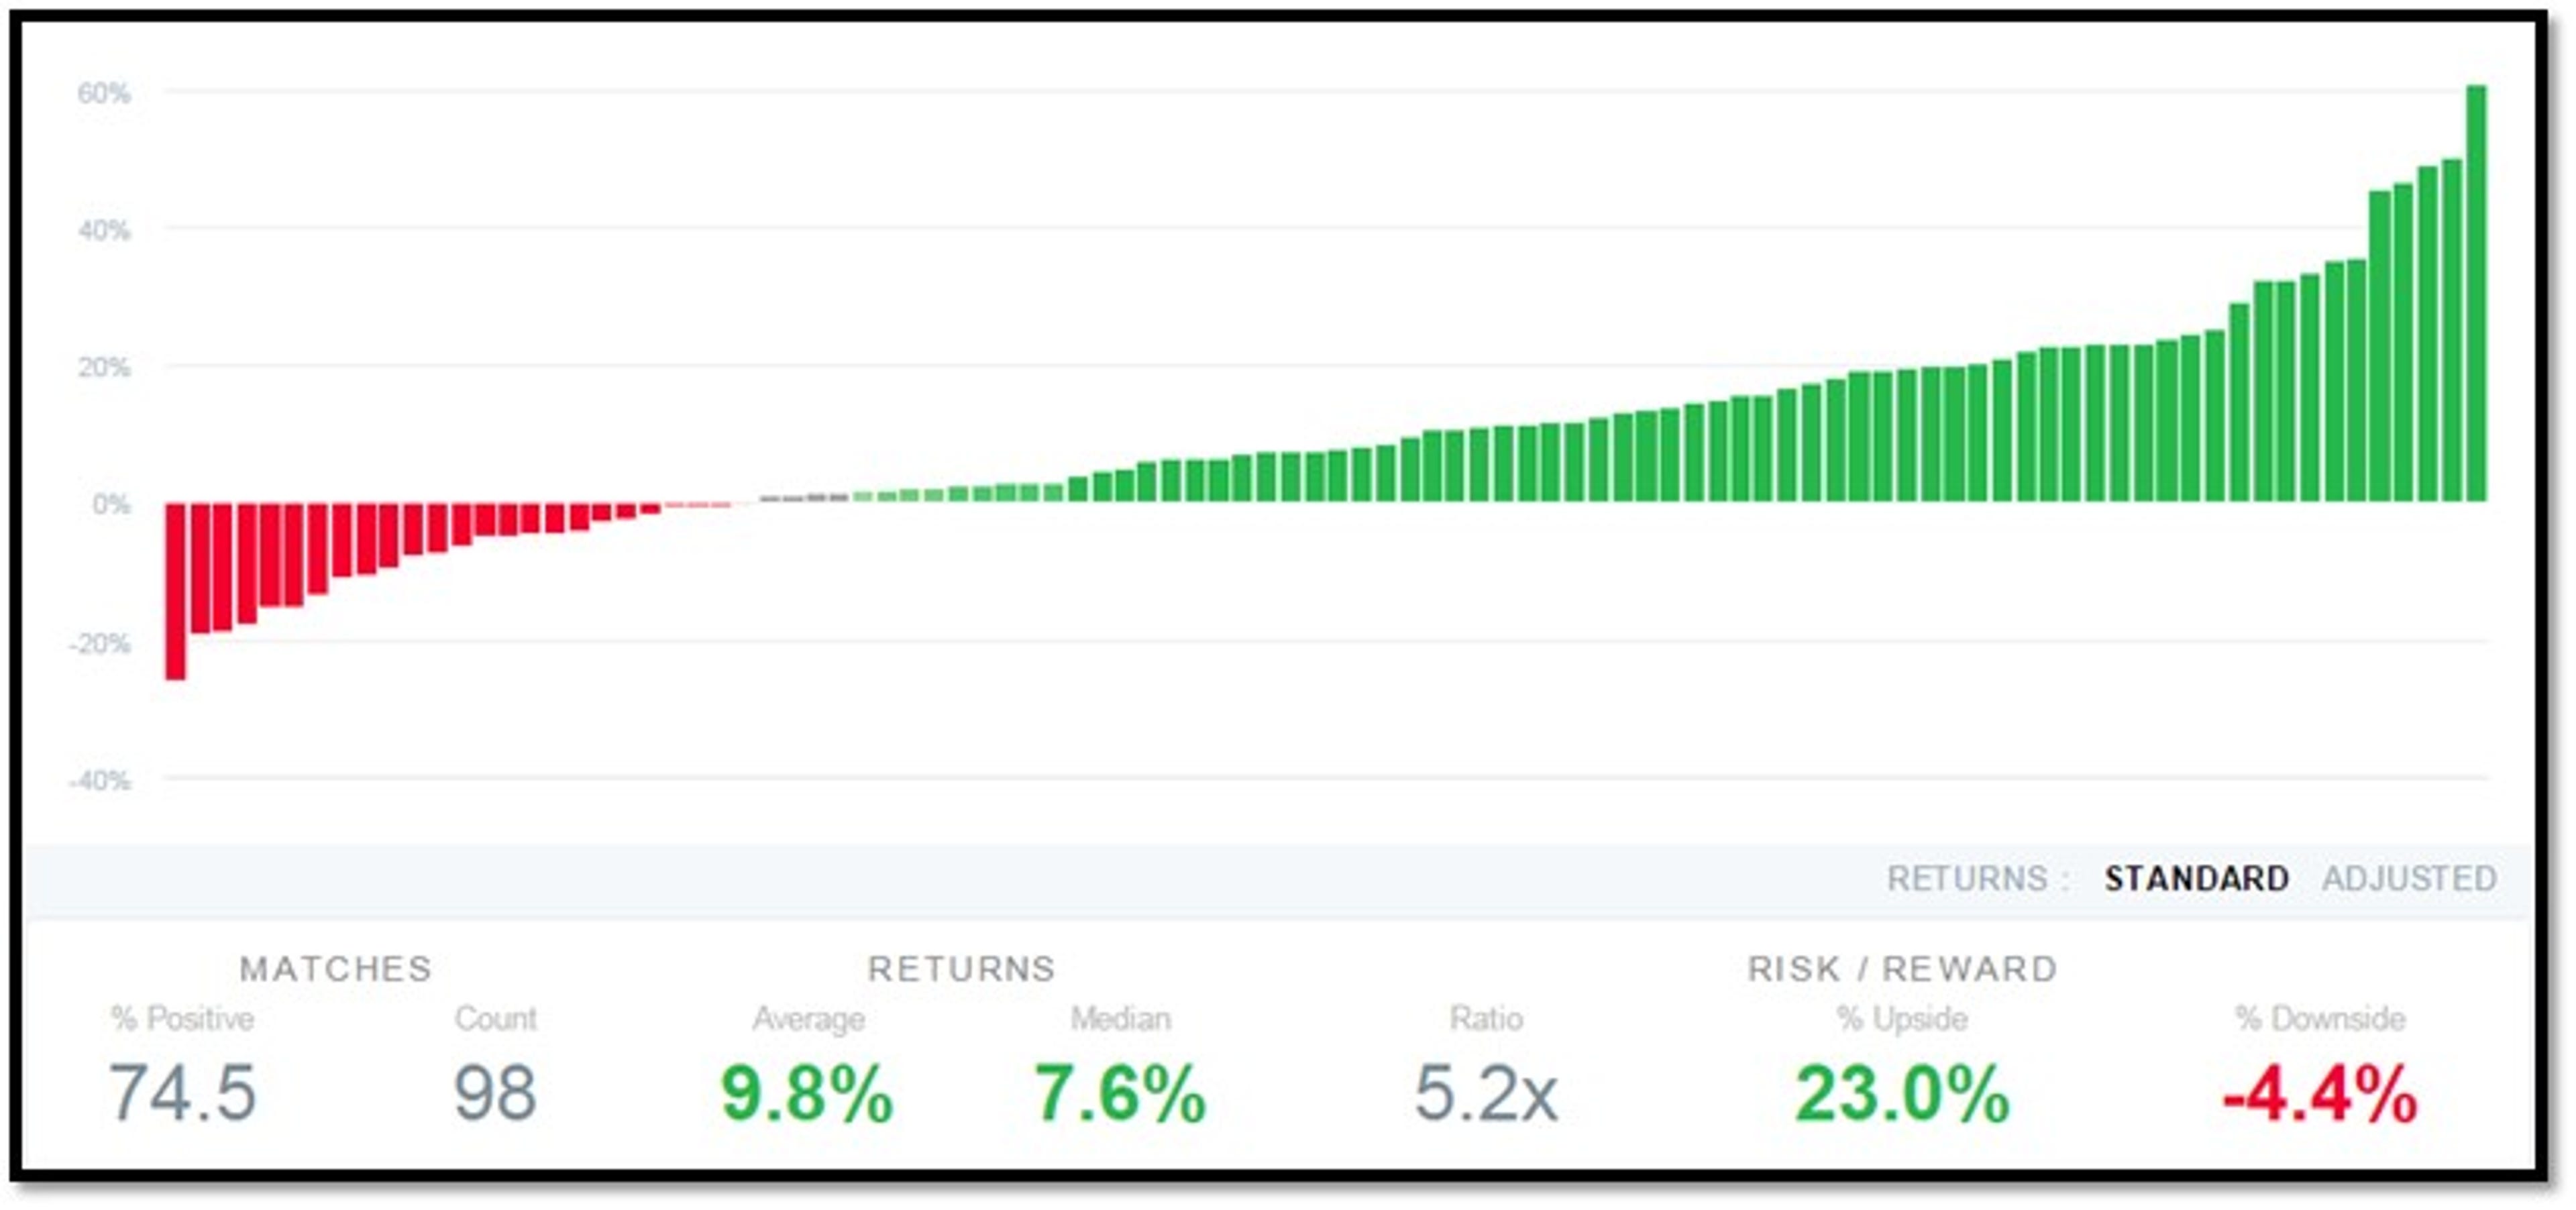
For the one-month projection, this analysis looked at the current three-month price trend in Zulily and found 98 instances in Specialty Retail stocks dating back to 1990.
The average return in the next month is 9.8 percent, with 5.2-times the upside to downside. There are 24 instances where the stock rebounded more than 20 percent, and only one instance where it dropped another 20 percent.


For a longer term view, the analysis then looked at the stock's current one-year price trend and found 86 similar instances in Specialty Retail stocks dating back to 1995.
The average return in the next year is 25.1 percent and there’s 4.1-times the upside to downside.

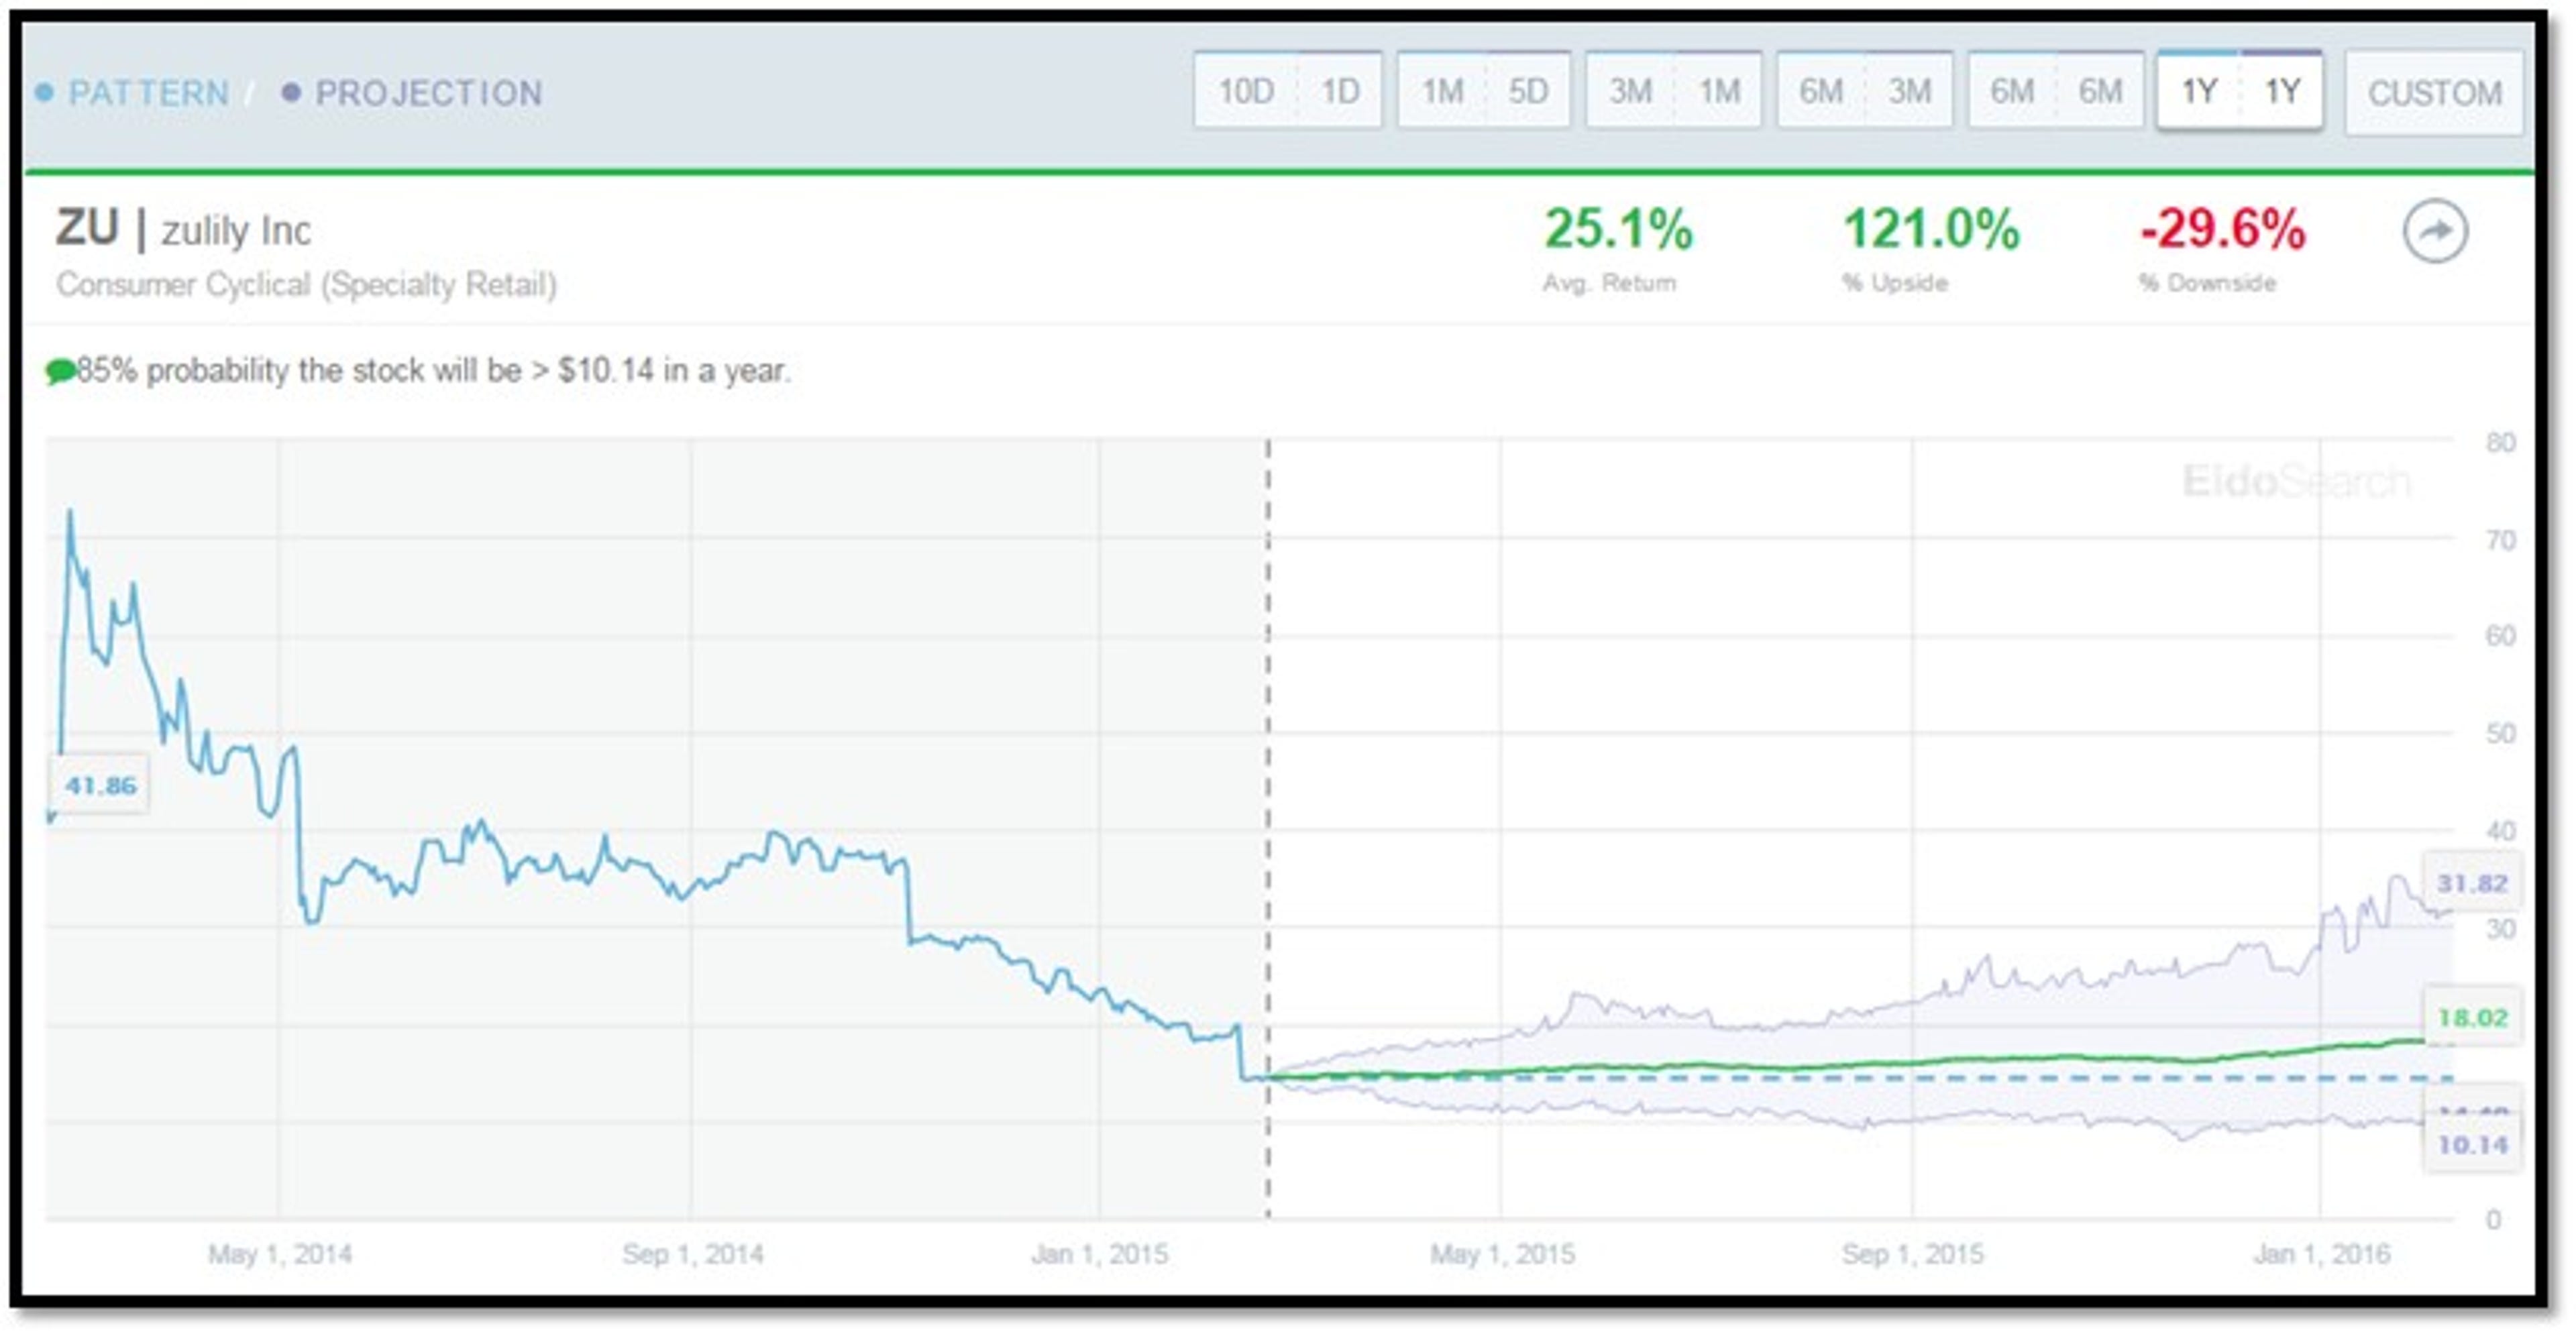
Image credit: Alonso Javier Torres, Wikimedia
© 2024 Benzinga.com. Benzinga does not provide investment advice. All rights reserved.
Trade confidently with insights and alerts from analyst ratings, free reports and breaking news that affects the stocks you care about.

