


Monday started with a nice ramp up that overflowed happily into Tuesday. But just as investors settled in to their newfound frothy sentiment (dreaming of QE and just right porridge), the market reversed. Turnaround Tuesday
But before we get carried away with the reversal, let’s look at why the market reversed.
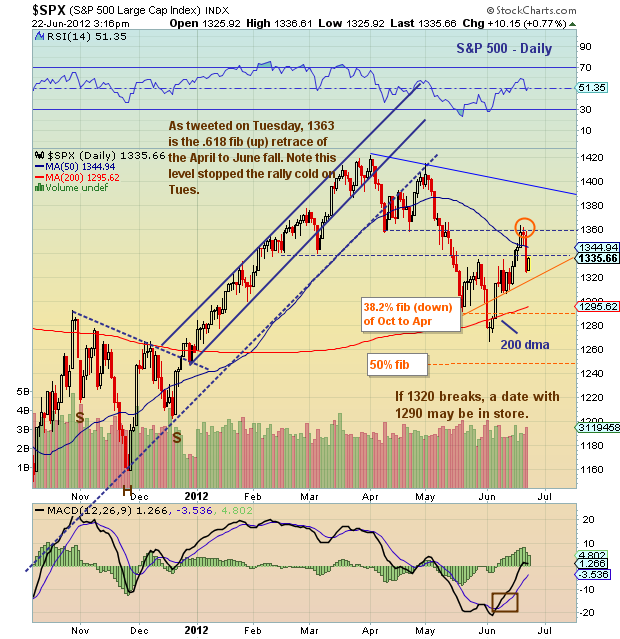
Well, from a macro risk management level, the market has come a long way; 97 points in two and a half weeks. As well, the markets were already more than setup for a sell the news event. And technically speaking, the market was pushing into an important Fibonacci up retracement level, 1363. I tweeted about this on Tuesday morning and sure enough, it stopped the rally cold.
So what do we make of the sell off? Well the drop was steep, so technical repair is necessary. The markets are attempting that today, with a nice sideways move, followed by a rally attempt higher. But I’m afraid it may take a few more days of sideways to build a base. Levels to watch include 1340 and 1363 (above) and 1324 and 1290 below.
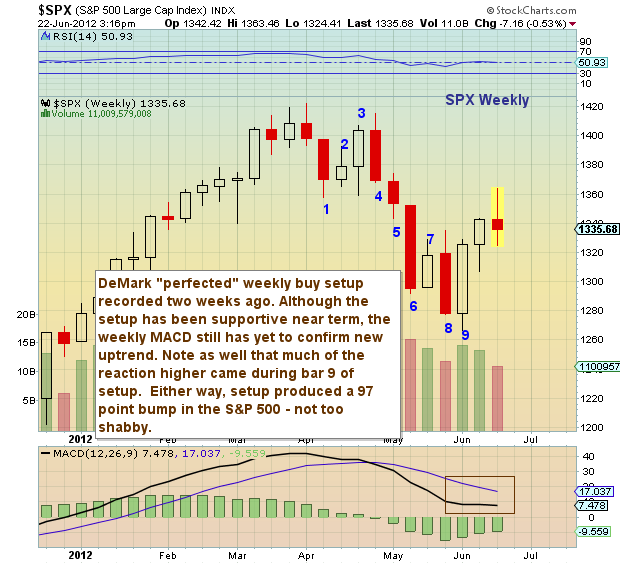
Note that this is the second week into an expected 1-4 week rally off the DeMark weekly buy setup that recorded two weeks ago. Note as well that much of the rally (and reversal higher) occurred during bar 9, so the next two weeks could be range bound between 1300 and 1365. See weekly chart below.
S&P 500 Daily Chart:
>
S&P 500 Weekly Chart:
© 2024 Benzinga.com. Benzinga does not provide investment advice. All rights reserved.
Trade confidently with insights and alerts from analyst ratings, free reports and breaking news that affects the stocks you care about.

