


There is currently a shorter list of a dozen ETFs oriented to primarily to global REITs (Real Estate Investment Trusts) with more on the way no doubt.
The established global REIT market has been volatile and rocked by the eurozone crisis and contagion to other global markets. In the list you’ll also note some China related issues which have caused concern over apparent property bubbles in both mainland China and Hong Kong. This issue had driven down prices but increased yields which are a staple attraction for most investors.
REITs remain popular with investors seeking greater dividends and income although many current yields remain historically low, perhaps misleading some investors expecting more. Further, some with higher dividends feature return of principal which should also be evaluated.
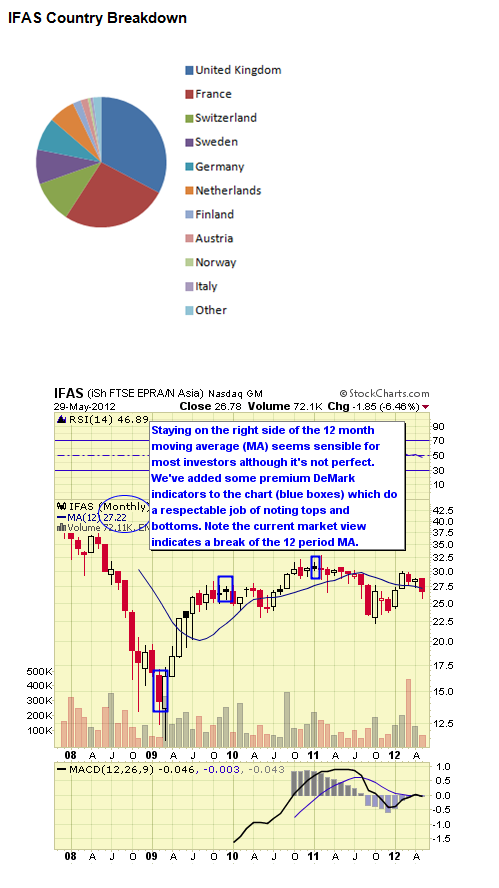
We feature a technical view of conditions from monthly chart views. Simplistically, we recommend longer-term investors stay on the right side of the 12 month simple moving average. When prices are above the moving average, stay long, and when below remain in cash or short. Premium members to the ETF Digest receive added signals when markets become extended such as DeMark triggers to exit overbought/oversold conditions.
For traders and investors wishing to hedge, leveraged and inverse issues are available to utilize from ProShares and Direxion and where available these are noted.
#10. iShares FTSE EPRA/NAREIT Developed Asia ETF IFAS


IFAS follows the FTSE EPRA/NAREIT Developed Asia Index. The fund was launched in November 2007. The expense ratio is 0.48%. AUM equal $23.5M and average daily trading volume is 12K shares. As of May 2012 the annual dividend yield was 3.40% and YTD return 7.66%. The 1 YR return was -12.28%.
A sister offering is iShares FTSE EPRA/NAREIT Developed Europe ETF IFEU which follows the same methodology as IFAS but applied to European offerings. The fund was launched in November 2007. The expense ratio is 0.48%. AUM equal $11.8M with average daily volume is 3K shares.
Data as of May 2012
IFAS Top Ten Holdings & Weightings
-
Unibail-Rodamco SE (UL): 15.75%
-
Land Securities Group PLC (LAND): 8.50%
-
Dz Bk Ag ([Wts/Rts]): 6.49%
-
Hammerson PLC (HMSO): 4.43%
-
Swiss Prime Site AG (SPSN): 4.19%
-
PSP Swiss Property AG (PSPN): 3.84%
-
Corio NV (CORA): 3.82%
-
Capital Shopping Centres Group PLC (CSCG): 3.14%
-
Klépierre (LI): 2.77%
-
Derwent London PLC (DLN): 2.66%
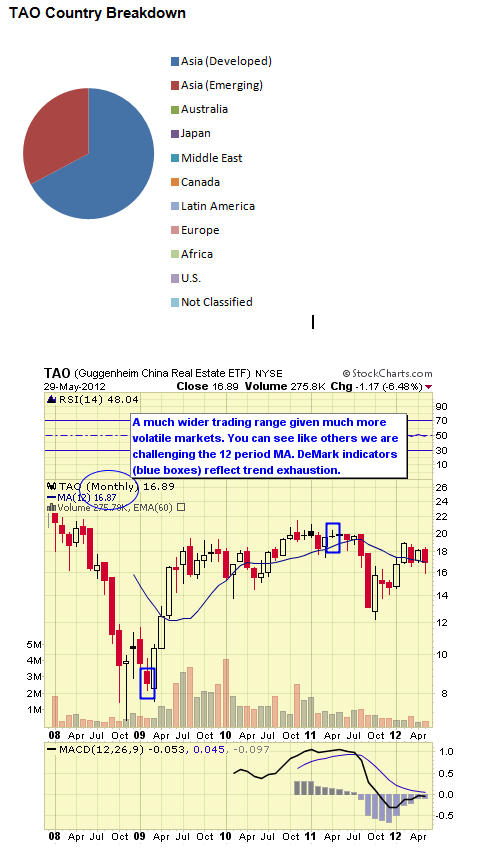
TAO which tracks the Alpha Shares China Real Estate Index which covers the greater China region including Special Administrative Regions like Macau and Hong Kong. It was launched in December 2007. The expense ratio is 0.65%. AUM equal $19M and average daily trading volume is 17K shares.
As of May 2012 the annual dividend yield was 1.18% and YTD return 10.52%. The 1 YR return was -16.04%.
Data as of May 2012
TAO Top Ten Holdings & Weightings
-
Sino Land Co., Ltd. H Shares (00083): 5.38%
-
Hongkong Land Holdings Ltd. (H78): 5.28%
-
Wharf holdings H Shares (00004): 5.25%
-
Hang Lung Properties Ltd. H Shares (00101): 5.12%
-
China Overseas Land & Investment Ltd. H Shares (00688): 4.98%
-
Henderson Land Development Co., Ltd. H Shares (HLDVF): 4.85%
-
Cheung Kong Holdings, Ltd. H Shares (00001): 4.71%
-
Link Real Estate Investment Trust (00823): 4.55%
-
Hang Lung Group Ltd. H Shares (00010): 4.39%
-
New World Development Co., Ltd. H Shares (00017): 4.31%
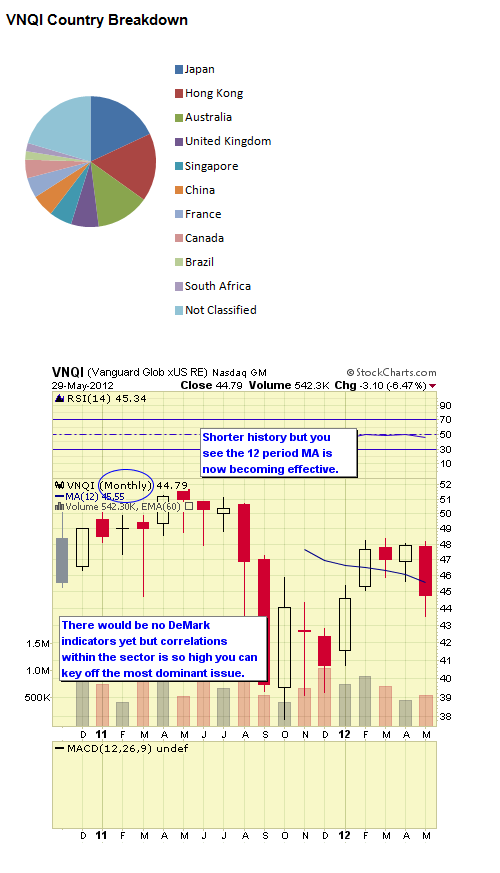
#8. Vanguard ex-U.S. Real Estate ETF VNQI

VNQI follows the S&P Global ex-U.S. Property Index which incorporates REITs in developed and emerging markets. The fund was launched in January 2010. The expense ratio is 0.35%. AUM equal $237M and average daily trading volume is 32K shares.
As of May 2012 the annual dividend yield was 3.03% and YTD return 7.79%. The 1 YR return was -11.73%. VNQI trades commission free at Vanquard.
Data as of May 2012
VNQI Top Ten Holdings & Weightings
-
Sun Hung Kai Properties, Ltd. (00016): 3.65%
-
Mitsubishi Estate (8802): 3.57%
-
Westfield Group (WEFIF): 3.27%
-
Cheung Kong Holdings, Ltd. (00001): 3.23%
-
Unibail-Rodamco Se (UL): 3.17%
-
Mitsui Fudosan Co., Ltd. (8801): 2.36%
-
Link Real Estate Investment Trust (00823): 1.61%
-
Stockland (STKAF): 1.51%
-
Land Securities Group PLC (LAND): 1.49%
-
Sumitomo Realty & Development Co., Ltd. (8830): 1.48%
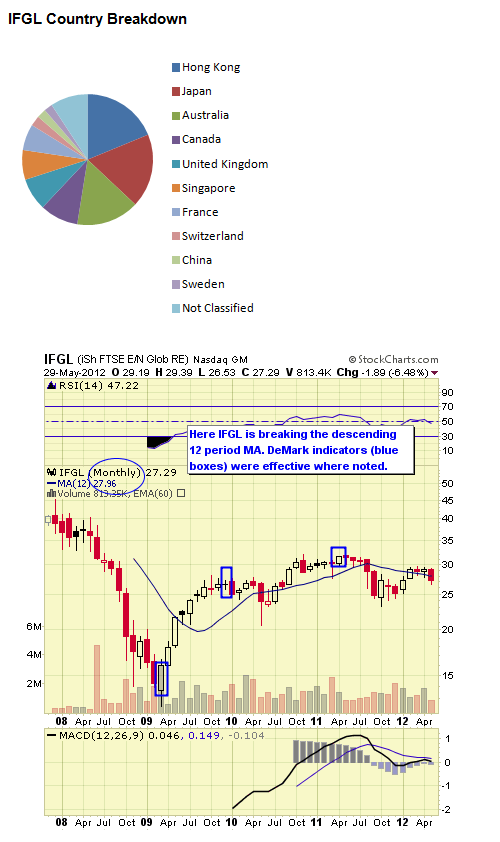
IFGL follows the FTSE EPRA/NAREIT Developed Real Estate ex-U.S. Index which follows REITs listed in markets outside the U.S. The fund was launched in November 2007. The expense ratio is 0.48%. AUM equal $417M and average daily trading volume is 56K shares.
As of May 2012 the annual dividend yield was 3.34% and YTD return 6.10%. The 1 YR return was -13.46%.
Data as of May 2012
IFGL Top Ten Holdings & Weightings
-
Sun Hung Kai Properties, Ltd. (00016): 5.35%
-
Westfield Group (WEFIF): 5.01%
-
Mitsubishi Estate (8802): 4.16%
-
Unibail-Rodamco SE (UL): 3.85%
-
Mitsui Fudosan Co., Ltd. (8801): 3.58%
-
Sumitomo Realty & Development Co., Ltd. (8830): 2.57%
-
HongKong Land Holdings Ltd. (H78): 2.42%
-
Link Real Estate Investment Trust (00823): 2.14%
-
Wharf holdings (00004): 2.12%
-
Land Securities Group PLC (LAND): 2.08%
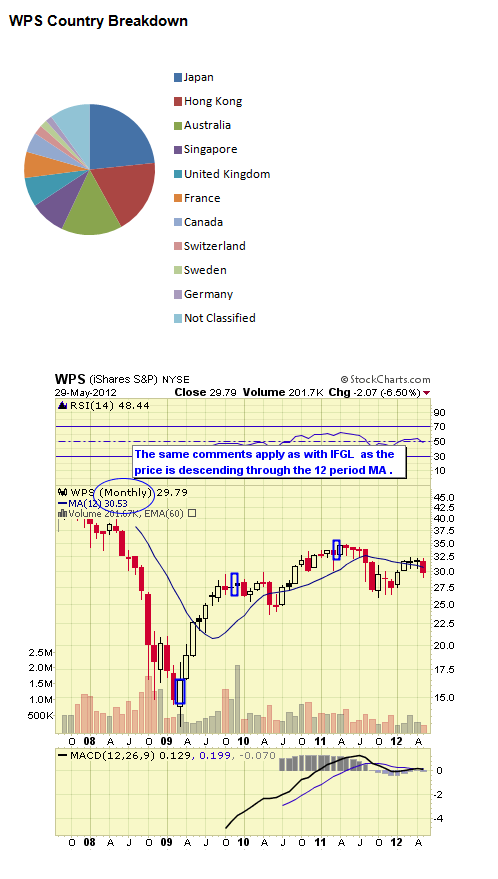
#6. iShares Developed Real Estate ex-U.S. ETF WPS
WPS follows the S&P Developed ex-U.S. Property Index which measures the performance of property in developed countries outside the U.S. The fund was launched in July 2007. The expense ratio is 0.48%. AUM equal $123M and average daily trading volume is less than 16K shares.
As of May 2012 the annual dividend yield was 3.53% and YTD return 6.25%. The 1 YR return was -13.11%.
Data as of May 2012
WPS Top Ten Holdings & Weightings
- Mitsubishi Estate (8802): 4.62%
-
Westfield Group (WEFIF): 4.26%
-
Cheung Kong Holdings, Ltd. (00001): 3.87%
-
Sun Hung Kai Properties, Ltd. (00016): 3.75%
-
Unibail-Rodamco SE (UL): 3.68%
-
Mitsui Fudosan Co., Ltd. (8801): 2.99%
-
Sumitomo Realty & Development Co., Ltd. (8830): 2.34%
-
Land Securities Group PLC (LAND): 1.96%
-
Link Real Estate Investment Trust (00823): 1.90%
-
Westfield Retail Trust (WRT): 1.63%
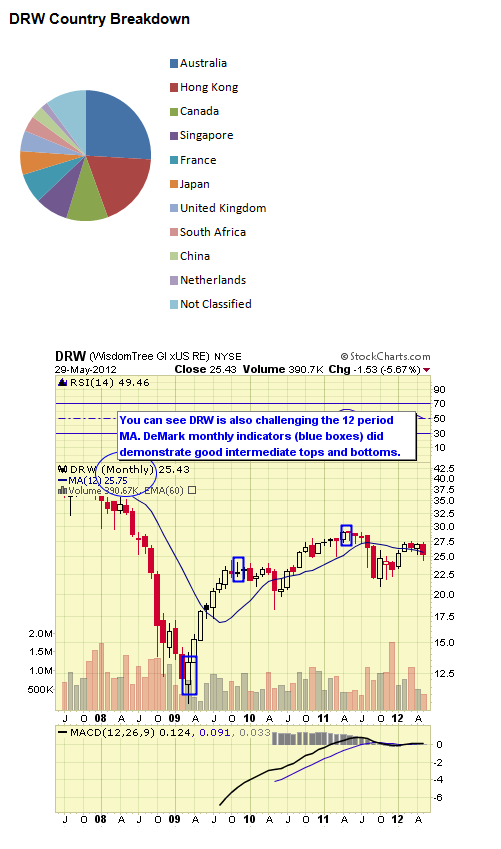
#5. WisdomTree Global ex-U.S. Real Estate ETF DRW
DRW follows the WisdomTree Global ex-U.S. Real Estate Index follows companies with market capitalizations greater than $1 billion including REITs, real estate operating companies, real estate development companies, and may include Passive Foreign Investment Companies (PFICs). The fund was launched in June 2007. The expense ratio is 0.58%. AUM equal $100M and average daily trading volume is near 32K shares.
As of May 2012 the annual dividend yield was 5.15% and YTD return 7.15%. The I YR return was -11.52%. DRW trades commission free at E*Trade.
Data as of May 2012
DRW Top Ten Holdings & Weightings
-
Westfield Group (WEFIF): 9.83%
-
Cheung Kong Holdings, Ltd. (00001): 3.34%
-
Sun Hung Kai Properties, Ltd. (00016): 3.23%
-
Stockland Corporation Limited (STKAF): 3.09%
-
Unibail-Rodamco SE (UL): 2.63%
-
CFS Retail Property Trust (CGNRF): 2.24%
-
GPT Group (GPT): 2.19%
-
Mirvac Group (MGR): 1.78%
-
Riocan Real Estate Investment Trust (RIOCF): 1.68%
-
Daito Trust Construction Co Ltd. (1878): 1.60%
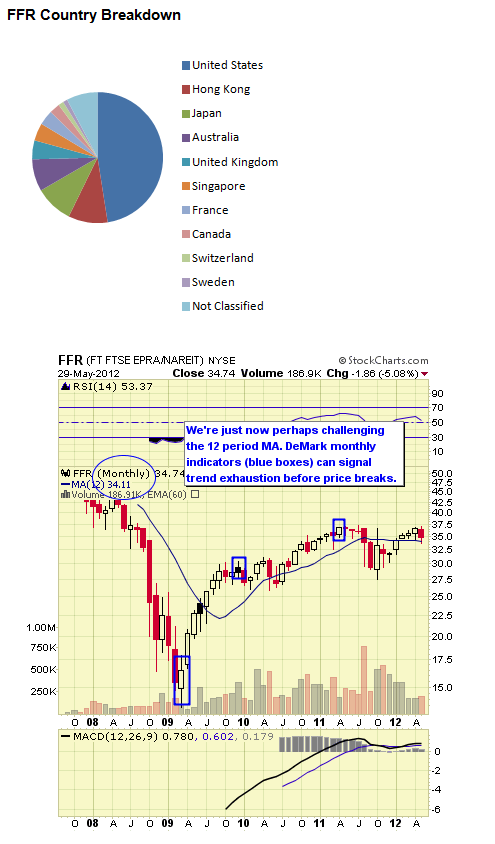
FFR follows the FTSE EPRA/NAREIT Developed Index which tracks companies in the North American, European and Asian markets. The fund was launched August 2007. The expense ratio is 0.60%. AUM equal $77M and average daily trading volume is less than 9K shares.
As of May 2012 the annual dividend yield was 2.52% and YTD return 7.01%. The 1 YR return was –5.23%.
Data as of May 2012
FFR Top Ten Holdings & Weightings
-
Simon Property Group Inc (SPG): 5.05%
-
Sun Hung Kai Properties, Ltd. (00016): 2.85%
-
Westfield Group (WEFIF): 2.46%
-
Mitsubishi Estate (8802): 2.17%
-
Equity Residential (EQR): 2.14%
-
Unibail-Rodamco SE (UL): 2.13%
-
Public Storage (PSA): 2.05%
-
Mitsui Fudosan Co., Ltd. (8801): 1.95%
-
Prologis Inc (PLD): 1.93%
-
Ventas Inc (VTR): 1.91%
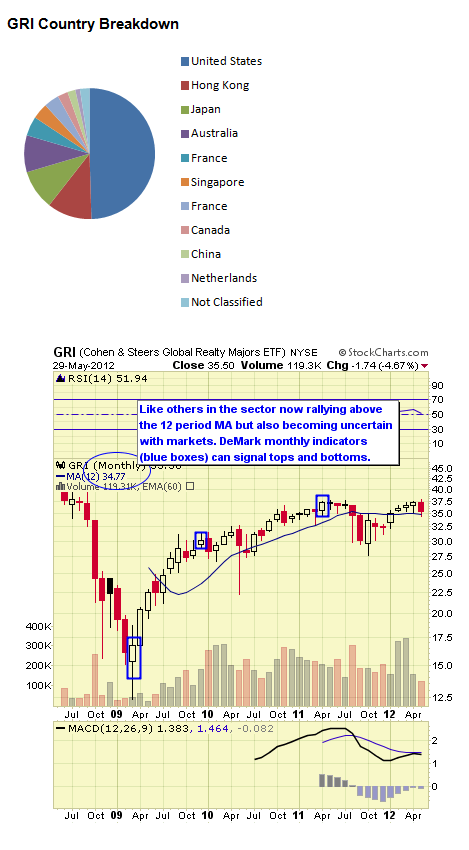
#3. Cohen & Steers Global Realty ETF GRI

GRI follows the Chen & Steers Global Realty Majors Index which is a free-float adjusted, modified market capitalization-weighted index of global real estate equities that are selected by Cohen & Steers investment committee. The fund was launched in May 2008. The expense ratio is 0.55%. AUM equal $62M with average daily trading volume 9K shares.
As of May 2012 the annual dividend yield was 2.32% and YTD return 7.86%. The 1 YR return was -4.82%.
Data as of May 2012
GRI Top Ten Holdings & Weightings
- Simon Property Group Inc (SPG): 4.12%
- Mitsubishi Estate (8802): 3.95%
- Public Storage (PSA): 3.50%
- Westfield Group (WEFIF): 3.46%
- Sun Hung Kai Properties, Ltd. (00016): 3.34%
- Equity Residential (EQR): 3.32%
- Unibail-Rodamco SE (UL): 3.25%
- Prologis Inc (PLD): 2.95%
- Ventas Inc (VTR): 2.94%
- Mitsui Fudosan Co., Ltd. (8801): 2.88%
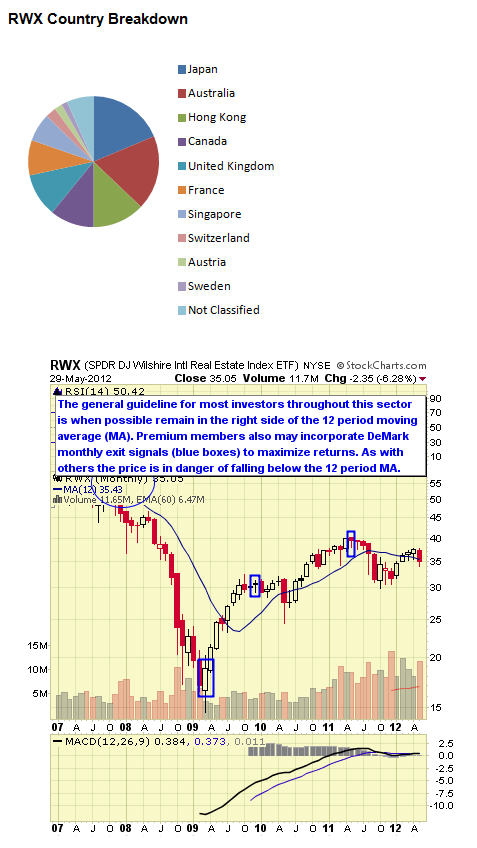
#2. SPDR DJ International Real Estate ETF RWX
RWX follows the Dow Jones Global ex-U.S. Real Estate Securities Index which covers REITs and real estate markets in developed and emerging market countries. The fund was launched in December 2006. The expense ratio is 0.59%. AUM equal $2.5B and average daily trading volume is over 491K shares.
As of May 2012 the annual dividend yield was 3.36% and YTD return 8.61% which reversed nearly a 10% loss as of October 2011. The 1 YR return was -11.21%. RWX trades commission free at TD Ameritrade.
Data as of May 2012
RWX Top Ten Holdings & Weightings
-
Westfield Group (WEFIF): 7.10%
-
Brookfield Asset Management, Inc. (BAM): 6.41%
-
Unibail-Rodamco SE (UL): 5.93%
-
Mitsui Fudosan Co., Ltd. (8801): 5.66%
-
Link Real Estate Investment Trust (00823): 3.28%
-
Land Securities Group PLC (LAND): 3.21%
-
Hang Lung Properties Ltd. (00101): 2.86%
-
Westfield Retail Trust (WRT): 2.84%
-
Hongkong Land Holdings Ltd. (H78): 2.67%
-
Dz Bk Ag ([Wts/Rts]): 2.45%
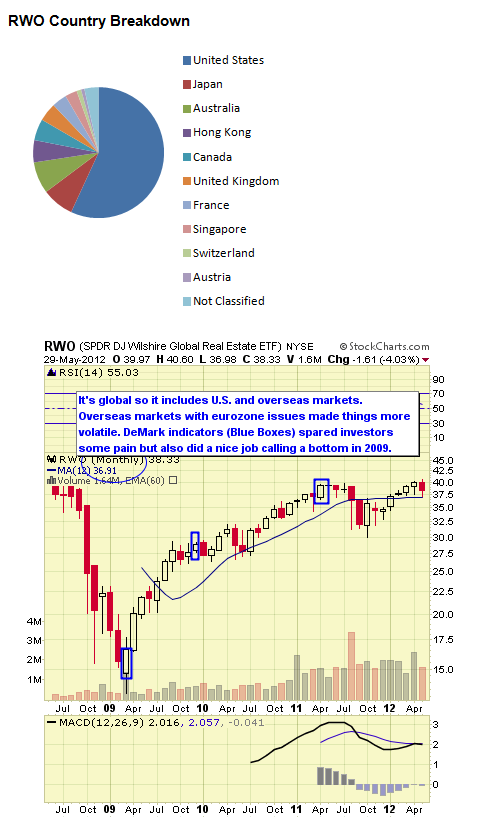
RWO follows the Dow Jones Global Select Real Estate Securities Index which is a float-adjusted market capitalization index measuring securities in developed and emerging market countries. The fund was launched in May 2008. The expense ratio is 0.50%. AUM equal $404M and average daily trading volume is 85K shares.
As of May 2012 the annual dividend yield was 2.37% and YTD return was 8.25% reversing a 8% loss just three months prior. The 1 YR return was -2.75%. RWO trades commission free at TD Ameritrade.
Data as of May 2012
RWO Top Ten Holdings & Weightings
-
Simon Property Group Inc (SPG): 6.71%
-
Westfield Group (WEFIF): 3.01%
-
Public Storage (PSA): 2.98%
-
Brookfield Asset Management, Inc. (BAM): 2.72%
-
Equity Residential (EQR): 2.67%
-
Unibail-Rodamco SE (UL): 2.51%
-
Ventas Inc (VTR): 2.49%
-
HCP Inc (HCP): 2.48%
-
Prologis Inc (PLD): 2.42%
-
Mitsui Fudosan Co., Ltd. (8801): 2.40%
We rank the top 10 ETF by our proprietary stars system as outlined below. However, given that we’re sorting these by both short and intermediate issues we have split the rankings as we move from one classification to another.
Strong established linked index
Excellent consistent performance and index tracking
Low fee structure
Strong portfolio suitability
Excellent liquidity

Established linked index even if “enhanced”
Good performance or more volatile if “enhanced” index
Average to higher fee structure
Good portfolio suitability or more active management if “enhanced” index
Decent liquidity


Enhanced or seasoned index
Less consistent performance and more volatile
Fees higher than average
Portfolio suitability would need more active trading
Average to below average liquidity


Index is new
Issue is new and needs seasoning
Fees are high
Portfolio suitability also needs seasoning
Liquidity below average


Global and international REITs have faced more volatility given how unsettled markets became in the eurozone and fears of a housing bubble in China. These fears have remain elevated as the news cycle heralds trouble or relief.
It’s also important to remember that ETF sponsors have their own competitive business interests when issuing products which may not necessarily align with your investment needs.
New ETFs from highly regarded and substantial new providers are also being issued. These may include Charles Schwab’s ETFs and Scottrade’s Focus Shares which both are issuing new ETFs with low expense ratios and commission free trading at their respective firms. These may also become popular as they become seasoned.
As stated with other sectors, remember ETF sponsors must issue and their interests aren’t aligned with yours. They have a business interest and wish to have a competitive presence in any popular sector.
For further information about portfolio structures using technical indicators like DeMark and other indicators see www.etfdigest.com. You may follow us on Facebook as well and join our group conversations.
You may address any feedback to: feedback@etfdigest.com
The ETF Digest has no current positions in the featured ETFs.
(Source for data is from ETF sponsors and various ETF data providers.)
© 2024 Benzinga.com. Benzinga does not provide investment advice. All rights reserved.
Trade confidently with insights and alerts from analyst ratings, free reports and breaking news that affects the stocks you care about.

