


During the first quarter of 2012 the technology sector was leading markets higher overall. This was especially so given Apple’s (AAPL) rapid growth and overweighting in many tech indexes. This is made especially vivid when comparing an equal weight index to more popular issues as noted below. Apple’s high weighting is a door that can swing both ways. When times are good for the company that enhances returns, but should the stock price falter the opposite would hold true.
There are currently nearly three dozen ETFs oriented to the technology sector with more on the way. The following analysis features a fair representation of ETFs available including subsectors. We believe from these investors may choose an appropriate ETF to satisfy the best index-based offerings individuals and financial advisors may utilize.
ETFs are based on indexes tied to well-known index providers including Russell, S&P, Barclays, MSCI, Dow Jones, etc. Also included are some so-called “enhanced” indexes that attempt to achieve better performance through more active management of the index.
Previously we had avoided using HOLDRS however Van Eck has assumed most of these including previously popular SMH (ML Semiconductor HOLDRS) which bears the same ticker symbol but has kept many of the components intact to not disrupt or upset previous investors. These weightings and constituents will change over time.
We feature a technical view of conditions from monthly chart views. Simplistically, we recommend longer-term investors stay on the right side of the 12 month simple moving average. When prices are above the moving average, stay long, and when below remain in cash or short. Some more interested in a fundamental approach may not care so much about technical issues preferring instead to buy when prices are perceived as low and sell for other reasons when high; but, this is not our approach.
Premium members to the ETF Digest receive added signals when markets become extended such as DeMark triggers to exit overbought/oversold conditions.
It’s not really fair to rank the ETFs chosen since there are choices between price-weighted, those linked to enhanced indexes and those targeted to subsectors. They’re all quite good and are thus subject to individual choice and objective.
For sophisticated traders and investors wishing to hedge or speculate leveraged long/short and inverse issues are available from ProShares and DirexionShares.
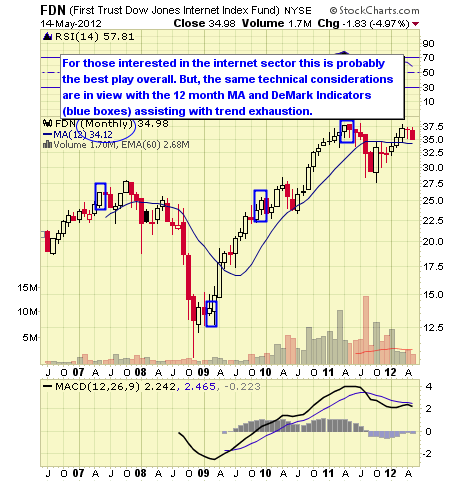
#10: First Trust Internet ETF (FDN)


FDN follows the Dow Jones Internet Index which demands a constituent company must have 50% of its revenues from the internet. It was launched in June 2006. The expense ratio is 0.60%. AUM equal $521M and average daily trading volume is 113K shares.
In our opinion this ETF provides the greatest exposure to companies in this important sector. As of May 2012 annual dividend yield was 0.06% and YTD return 9.85%. The 1 YR return was -4.67%.
Data as of May 2012
FDN Top Ten Holdings & Weightings
- Google, Inc. Class A (GOOG): 10.08%
- Amazon.com Inc (AMZN): 7.69%
- eBay Inc (EBAY): 6.05%
- Priceline.com, Inc. (PCLN): 5.94%
- Salesforce.com, Inc. (CRM): 4.59%
- Yahoo! Inc (YHOO): 4.46%
- Juniper Networks, Inc. (JNPR): 3.88%
- Check Point Software Technologies, Ltd. (CHKP): 3.69%
- Netflix, Inc. (NFLX): 3.00%
- Akamai Technologies, Inc. (AKAM): 2.96%

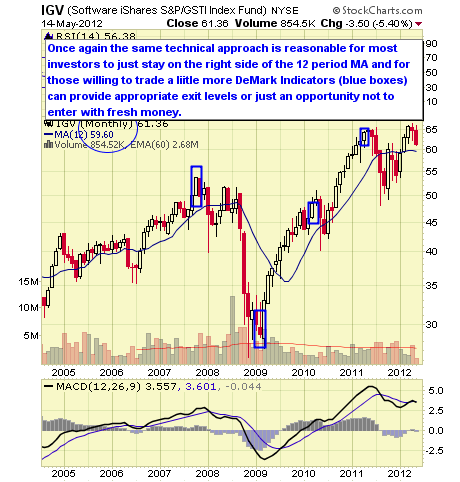
#9: iShares Software ETF (IGV)
IGV tracks the S&P North American Technology Software Index. The fund was launched in July 2001. The expense ratio is 0.48%. AUM equal $610M and average daily trading volume is roughly 104K shares. As of May 2012 annual dividend yield was 0.04% and YTD return 13.38%. The 1 YR return was -4.99%.
Alternative choice might include PowerShares Dynamic Software ETF (PSJ). The latter tracks the Dynamic Software Intellidex Index an enhanced index which seeks to more actively manage the constituents via quantitative methodologies. As of May 2012 annual dividend yield was not available and YTD return 11.26%. The 1 YR return was -3.90%.
Data as of May 2012
IGV Top Ten Holdings & Weightings
- Microsoft Corporation (MSFT): 9.63%
- Salesforce.com, Inc. (CRM): 7.93%
- Oracle Corporation (ORCL): 7.30%
- Intuit, Inc. (INTU): 6.40%
- Adobe Systems Inc (ADBE): 6.21%
- Citrix Systems, Inc. (CTXS): 5.95%
- Red Hat, Inc. (RHT): 4.34%
- Symantec Corp (SYMC): 4.23%
- CA, Inc. (CA): 3.62%
- Autodesk, Inc. (ADSK): 3.35%
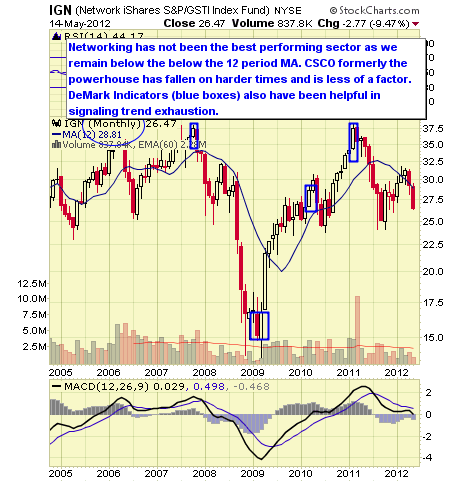
#8: iShares Networking ETF (IGN)
IGN tracks the S&P North American Technology-Multimedia Networking Index. The fund was launched in July 2001. The expense ratio is 0.48%. AUM equal nearly $239M with average daily trading volume 67K shares. As of May 2012 annual dividend yield was 0.30% and YTD return -2.49%. The 1 YR return was -24.35%.
An alternative choice is PowerShares Dynamic Networking ETF (PXQ) which tracks the Dynamic Networking Intellidex Index. As of May 2012 annual dividend yield was 0.44% and YTD return 5.39%. The 1 YR return was -11.57%. The difference in performance is due to a lower weighting in Cisco (CSCO) and other underperforming constituents. This makes the enhancement of the index methodology marginally more effective in this case.
Data as of May 2012
IGN Top Ten Holdings & Weightings
- Juniper Networks, Inc. (JNPR): 8.75%
- Qualcomm, Inc. (QCOM): 8.69%
- Motorola Mobility Holdings, Inc. (MMI): 8.58%
- Motorola Solutions, Inc. (MSI): 8.50%
- Cisco Systems Inc (CSCO): 8.37%
- Harris Corporation (HRS): 4.68%
- F5 Networks, Inc. (FFIV): 4.34%
- Riverbed Technology, Inc. (RVBD): 4.13%
- Research in Motion Ltd (RIMM): 4.04%
- Polycom, Inc. (PLCM): 3.54%
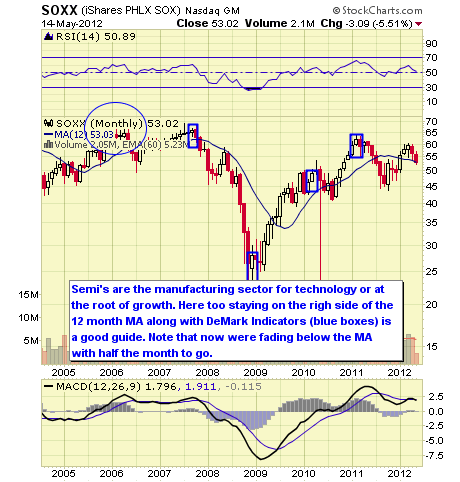
#7: iShares PHLX SOX Semiconductor ETF (SOXX)
SOXX tracks the popular PHLX Semiconductor Index. The fund was launched in October 2001. The expense ratio is 0.48%. AUM equal nearly $236M and average daily trading volume is 255K shares. As of May 2012, the annual dividend yield was 0.61% and YTD return 8.38%. The 1 YR return was 8.38%.
ProShares and Direxion feature issues for hedging and/or speculation.
Data as of May 2012
SOXX Top Ten Holdings & Weightings
- Intel Corp (INTC): 8.67%
- Taiwan Semiconductor Manufacturing ADR (TSM): 8.60%
- Broadcom Corporation (BRCM): 8.09%
- Texas Instruments, Inc. (TXN): 7.86%
- Applied Materials, Inc. (AMAT): 7.82%
- KLA-Tencor Corporation (KLAC): 4.42%
- NXP Semiconductor NV (NXPI): 4.28%
- Marvell Technology Group, Ltd. (MRVL): 4.11%
- Xilinx Inc (XLNX): 4.04%
- Linear Technology (LLTC): 4.01%
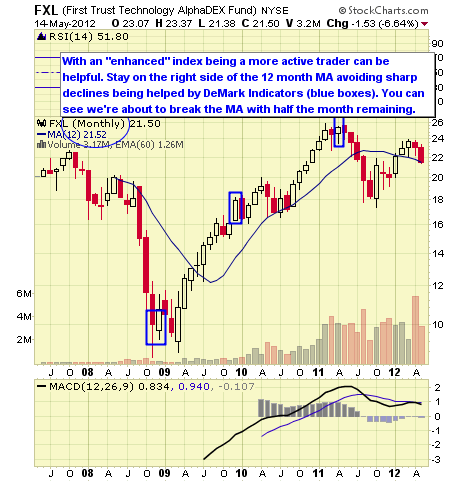
#6: FirstTrust Technology AlphaDEX ETF (FXL)
FXL follows the StrataQuant Technology Index which focuses on those select technology stocks in the Russell 1000 Index. From this First Trust employs an enhanced strategy to select and alter the index. The fund was launched in May 2007. The expense ratio is 0.70%. AUM equal $262M and average daily trading volume is 197K shares. As of May 2012 annual dividend yield was 0.03% and YTD return was 8.23%. The 1 YR return was -14.61%.
Data as of May 2012
FXL Top Ten Holdings Weightings
- Vishay Intertechnology, Inc. (VSH): 2.25%
- EchoStar Corp (SATS): 2.23%
- Rackspace Hosting, Inc. (RAX): 2.23%
- Western Digital Corporation (WDC): 2.22%
- Harris Corporation (HRS): 2.08%
- Teradyne Inc (TER): 2.06%
- Fairchild Semiconductor International Inc (FCS): 2.03%
- International Rectifier (IRF): 1.97%
- Equinix, Inc. (EQIX): 1.95%
- Avnet Inc (AVT): 1.94%
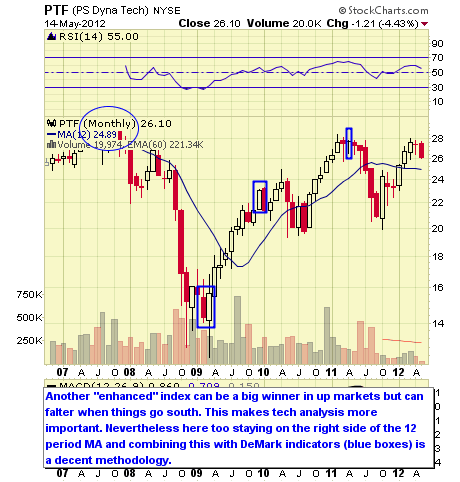
#5: PowerShares Dynamic Technology ETF (PTF)
PTF follows the Dynamic Technology Sector Intellidex Index which is another “enhanced” index modified by quantitative methodologies. The fund was launched in October 2006. The expense ratio is 0.60%. AUM equal $30M making and average daily trading volume is less than 4K shares.
As of May 2012 annual dividend yield was 0.06% and YTD return was 12.11%. The 1 YR return was -5.16%.
Data as of May 2012
PTF Top Ten Holdings & Weightings
- Apple, Inc. (AAPL): 2.79%
- KLA-Tencor Corporation (KLAC): 2.77%
- F5 Networks, Inc. (FFIV): 2.58%
- Activision Blizzard, Inc. (ATVI): 2.57%
- International Business Machines Corp (IBM): 2.57%
- Intel Corp (INTC): 2.56%
- Cisco Systems Inc (CSCO): 2.56%
- Western Digital Corporation (WDC): 2.53%
- Intuit, Inc. (INTU): 2.52%
- Alliance Data Systems Corporation (ADS): 2.51%
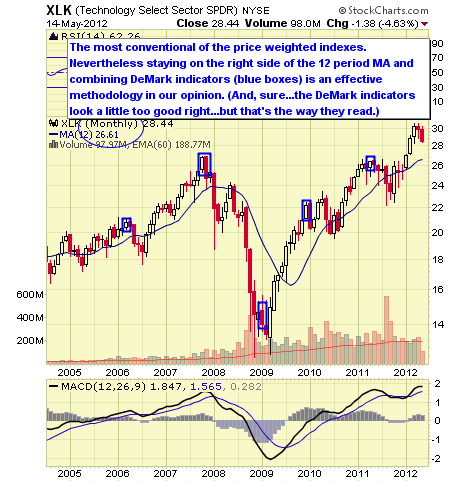
#4: SPDR Technology Sector ETF (XLK)

XLK follows the Technology Select Sector Index which breaks the S&P 500 to those companies involved in technology and relevant subsectors. The fund was launched December 1998. The expense ratio is 0.18%. AUM (Assets under Management) equal $9,108M while average daily trading volume is over 9M shares. As of May 2012 annual dividend yield was 1.05% and YTD return 11.75%. The 1 YR return was 8.79%.
ProShares and Direxion offer leveraged issues for hedging and/or speculation.
Data as of May 2012
XLK Top Ten Holdings & Weightings
- Apple, Inc. (AAPL): 18.46%
- International Business Machines Corp (IBM): 8.13%
- Microsoft Corporation (MSFT): 8.10%
- AT&T Inc (T): 6.61%
- Google, Inc. Class A (GOOG): 5.20%
- Intel Corp (INTC): 4.10%
- Oracle Corporation (ORCL): 3.93%
- Verizon Communications Inc (VZ): 3.90%
- Qualcomm, Inc. (QCOM): 3.68%
- Cisco Systems Inc (CSCO): 3.68%
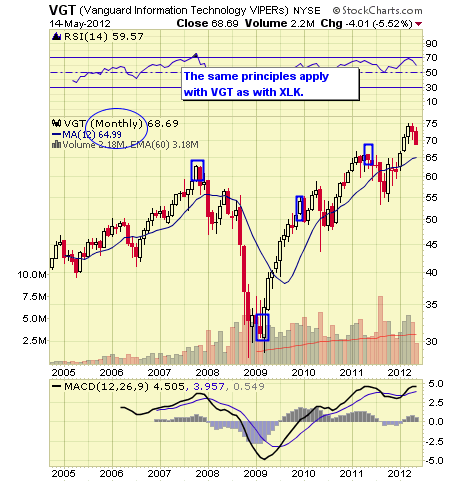
#3: Vanguard Information Technology ETF (VGT)
VGT follows the MSCI US Investable Market Information Technology 25/50 Index. The index consists of small to large companies in the broad technology space including various sectors and subsectors. The fund was launched January 2004. The expense ratio is 0.19%. AUM equal $2,333M with average daily trading volume 230K shares.
As of May 2012 annual dividend yield was .0.79% and YTD return 13.02%. The 1 YR return was 5.98%. VGT trades commission free at Vanguard.
Data as of May 2012
VGT Top Ten Holdings & Weightings
- Apple, Inc. (AAPL): 14.50%
- International Business Machines Corp (IBM): 8.48%
- Microsoft Corporation (MSFT): 7.56%
- Google, Inc. A (GOOG): 6.34%
- Intel Corp (INTC): 4.92%
- Oracle Corporation (ORCL): 4.01%
- Cisco Systems Inc (CSCO): 3.84%
- Qualcomm, Inc. (QCOM): 3.54%
- Hewlett-Packard Co (HPQ): 2.06%
- Visa, Inc. (V): 2.04%
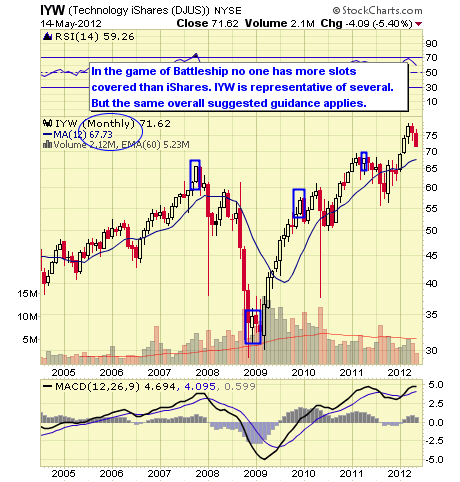
#2: iShares Dow Jones U.S. Technology ETF (IYW)
IYW follows the index of the same name. The fund was launched May 2000. The expense ratio is 0.48%. AUM equal $1,602M and average daily trading volume is 217K shares. As of May 2012 annual dividend yield was 0.45% and YTD return 12.08%. The 1 YR return was 6.92%.
Alternative choices with similar characteristics include SPDR MS Technology ETF (MTK) which follows the Morgan Stanley Technology Index. The expense ratio is 0.50%.
The iShares S&P/GSTI Technology ETF (IGM) follows the index of the same name. The expense ratio is 0.48%. Both ETFs have achieved similar rates of return with similar holdings.
Data as of May 2012
IYW Top Ten Holdings & Weightings
- Apple, Inc. (AAPL): 21.46%
- Microsoft Corporation (MSFT): 9.44%
- International Business Machines Corp (IBM): 8.99%
- Google, Inc. Class A (GOOG): 6.16%
- Intel Corp (INTC): 5.68%
- Oracle Corporation (ORCL): 4.53%
- Cisco Systems Inc (CSCO): 4.30%
- Qualcomm, Inc. (QCOM): 4.25%
- EMC Corporation (EMC): 2.28%
- Hewlett-Packard Co (HPQ): 1.95%
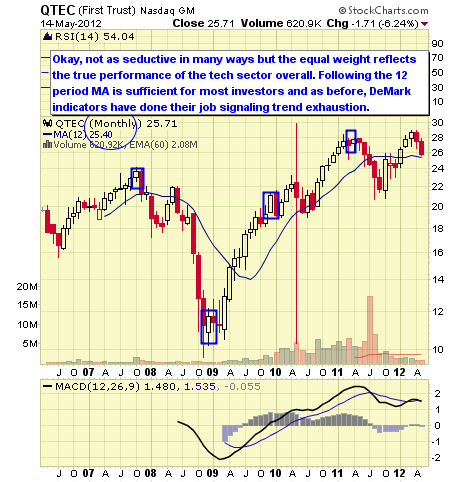
#1: First Trust NASDAQ 100 Technology ETF (QTEC)
QTEC follows the NASDAQ 100 Technology Sector Index is an equally weighted index. The fund was launched in April 2006. The expense ratio is 0.60%. AUM equal $157M while average daily trading volume is 51K shares. As of May 2012 annual dividend yield was .31% and YTD return 7,21%. The 1 YR return was -6.55%.
Most investors believe the logical alternative to QTEC is PowerShares NASDAQ 100 ETF (QQQ). It follows the NASDAQ 100 Index which includes the largest 100 nonfinancial companies listed on the NASDAQ. But it’s not a pure technology play with nearly 30% of constituents in other sectors.
Data as of First Quarter 2012
QTEC Top Ten Holdings & Weightings
- Baidu, Inc. ADR (BIDU): 2.47%
- Cisco Systems Inc (CSCO): 2.43%
- NVIDIA Corporation (NVDA): 2.43%
- KLA-Tencor Corporation (KLAC): 2.41%
- BMC Software, Inc. (BMC): 2.39%
- Qualcomm, Inc. (QCOM): 2.39%
- Broadcom Corporation (BRCM): 2.39%
- Autodesk, Inc. (ADSK): 2.38%
- Check Point Software Technologies, Ltd. (CHKP): 2.38%
- NetApp, Inc. (NTAP): 2.38%
We rank the top 10 ETF by our proprietary stars system as outlined below. However, given that we’re sorting these by both short and intermediate issues we have split the rankings as we move from one classification to another.
Strong established linked index
Excellent consistent performance and index tracking
Low fee structure
Strong portfolio suitability
Excellent liquidity
Established linked index even if “enhanced”
Good performance or more volatile if “enhanced” index
Average to higher fee structure
Good portfolio suitability or more active management if “enhanced” index
Decent liquidity
Enhanced or seasoned index
Less consistent performance and more volatile
Fees higher than average
Portfolio suitability would need more active trading
Average to below average liquidity


Index is new
Issue is new and needs seasoning
Fees are high
Portfolio suitability also needs seasoning
Liquidity below average


Technology and innovations in the sector remain a primary focus for investors. Clearly this sector will remain the leading source of innovation and economic growth in the U.S. and globally as well. As the sector expands overseas we’ll no doubt offer a review for these issues in another profile. Further new ETFs in social media will be entering the scene for good or bad. Already with the much-hyped Facebook IPO and the new Global X Social Media ETF (SOCL) may be much in view.
Investors should note that in a rising market particularly ETFs linked to enhanced issues will tend to outperform conventional index linked issues. I’ve not done enough analysis to determine their relative strength during down market periods.
New ETFs from highly regarded and substantial new providers are also being issued. These may include Charles Schwab’s ETFs and Scottrade’s Focus Shares which both are issuing new ETFs with low expense ratios and commission free trading at their respective firms. These may also become popular as they become seasoned.
As stated with other sectors, remember ETF sponsors must issue and their interests aren’t aligned with yours. They have a business interest and wish to have a competitive presence in any popular sector.
For further information about portfolio structures using technical indicators like DeMark and other indicators see www.etfdigest.com. You may follow us on Facebook as well and join our group conversations.
You may address any feedback to: feedback@etfdigest.com
The ETF Digest has a long position in XLK, FDN, IGV and VGT in a lazy hedged portfolio.
© 2024 Benzinga.com. Benzinga does not provide investment advice. All rights reserved.
Trade confidently with insights and alerts from analyst ratings, free reports and breaking news that affects the stocks you care about.

