


Loading...
Loading...
Yes, believe it or not, Italian number theory from the 13th century still rings true today, just as strong as the principles of Greek rhetoric or Roman construction. Although Italian mathematician Leonardo Fibonacci originally identified his number series alongside numerous other contributions to algebra, geometry, and indeterminate analysis, there are three numbers have truly immortalized him within the financial community. These fibonacci numbers of 32%, 68%, and 100% - the rounded-off percentages colloquialized by the modern trader - represent significant psychological and natural points of inflection for all types of stocks. Today, we look at a few stock setups within the gold sector that have retraced during their recent rallies to points of fibonacci support at 32%, 68%, and 100%.
Fibonacci retracement analysis is the art of identifying the type of pullbacks in the price of stocks and projecting a mathematical target price and stop-loss for a trade. This type of analysis is typically done on a chart using fibonacci plug-ins but (for the truly old-fashioned) can be completed with nothing more than paper and pencil. The goal of fibonacci is not to run complicated algorithms but, rather, to prepare a trader for a rational point to enter a trade, take profits, or admit loss.
We will begin with the first fibonacci support level of 32%, and proceed with subsequent examples at 68% and then 100%. If the reader is unfamiliar with fibonacci analysis, this article is written so as to be understandable to you.
We are measuring 32% as a pullback within an uptrend from the bottom to top of the rally. This means that in a simple example of a stock that rallies $10, a 32% retracement occurs when the stock pulls back to $16.80. (The $3.20 pullback represents 32% of the $10 rally.)
Rio Tinto RIOFor this 32% fibonacci setup, let us consider the chart of Rio Tinto
RIO. Rio Tinto mines gold in the USA, Chile, Indonesia, and Australia. It also extracts gold impurities during its copper refinement processes. This gold miner rallied from $42.04 in October to $62.20 in February, representing a rally of $20.16. As of the first day of trading for April, Rio Tinto is trading at $55.59. With some basic math, we see that Rio Tinto has pulled back to its first fibonacci retracement level: 32%.

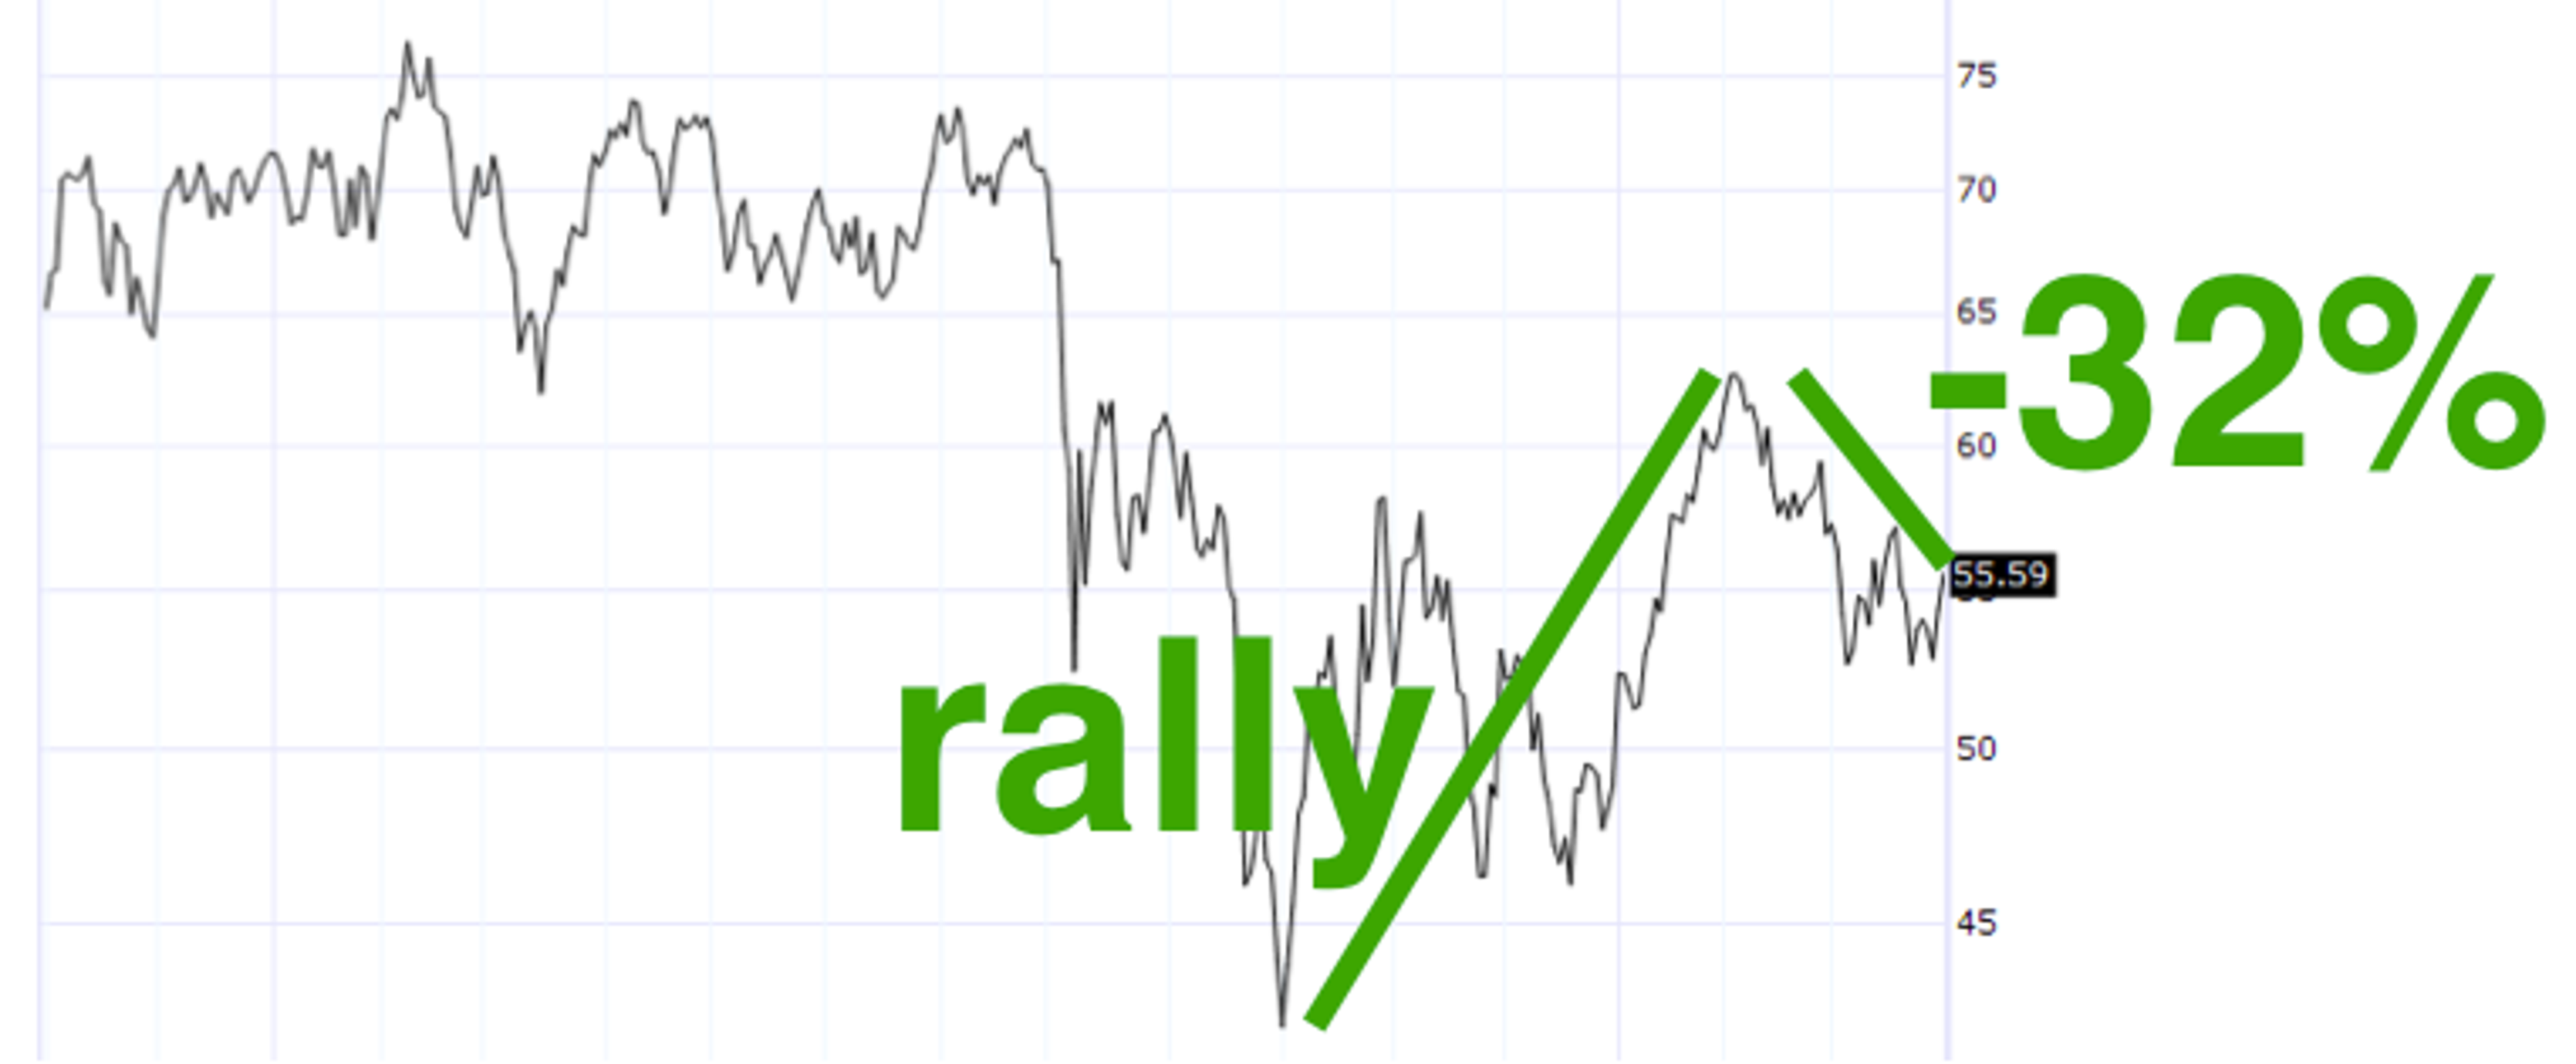
* 32% of $20.16 (the height of the rally) = $6.45
* $62.20 (the highest price) - $6.45 (the 32% retracement) = $55.75
* $55.75 is approximately the current price of Rio Tinto ($55.59)
*
Rio Tinto is at a 32% fibonacci support level within its recent rally.Next, we consider the second level of fibonacci support: 68%. Again, in a simple example of a $10 stock rally, the 68% retracement occurs when the stock pulls back $6.80 off its highs. (The $6.80 pullback represents 68% of the $10 rally.) So, we are looking for a gold stock that has pulled back 68% from the highs of its recent rally.
We find this to be the case for Ivanhoe Mines
IVNLoading...
Loading...
. Ivanhoe Mines mines gold deposits in multiple countries around the world. On October 3rd, 2011, Ivanhoe Mines rallied from $12.65 to $22.30 within about two months. This $9.65 rally has retraced during the past few months to $15.74 (Ivanhoe Mines' stock price going into April). A 68% retracement of the rally means a pullback of $6.56, and so measuring from the high: $22.30 - $6.56 = $15.74


* 68% of $9.65 (the height of the rally) = $6.56
* $22.30 (the highest price) - $6.56 (the 68% retracement) = $15.74
* $15.74 is the current price of Ivanhoe Mines
*
Ivanhoe Mines is at a 68% fibonacci support level within its recent rally.Pershing Gold PGLCFinally, we come to the fibonacci support level of 100%. Although fibonacci analysis can be used on only portions of a stock's history, such as in the above example, it is not prohibited to zoom all the way out and perform the analysis on the stock's entire history. To do this, let us take a look at Pershing Gold
PGLC. Pershing Gold recently changed its ticker symbol from SAGE, and so has a short stock chart with only five days of price history. It is an exploration company based out of Nevada. Because fibonacci traders prefer to rely on stronger levels of support whenever possible, many traders have waited for Pershing Gold to find the strongest level of fibonacci support before getting involved.
A 100% retracement in price can be clearly seen in the below stock chart, where price rallied from the opening price of $0.55 to a high of $0.93 and then declined by the same amount. This pyramid-shaped chart represents a textbook example of a 100% fibonacci retracement, which is one of the final and strongest levels of support.
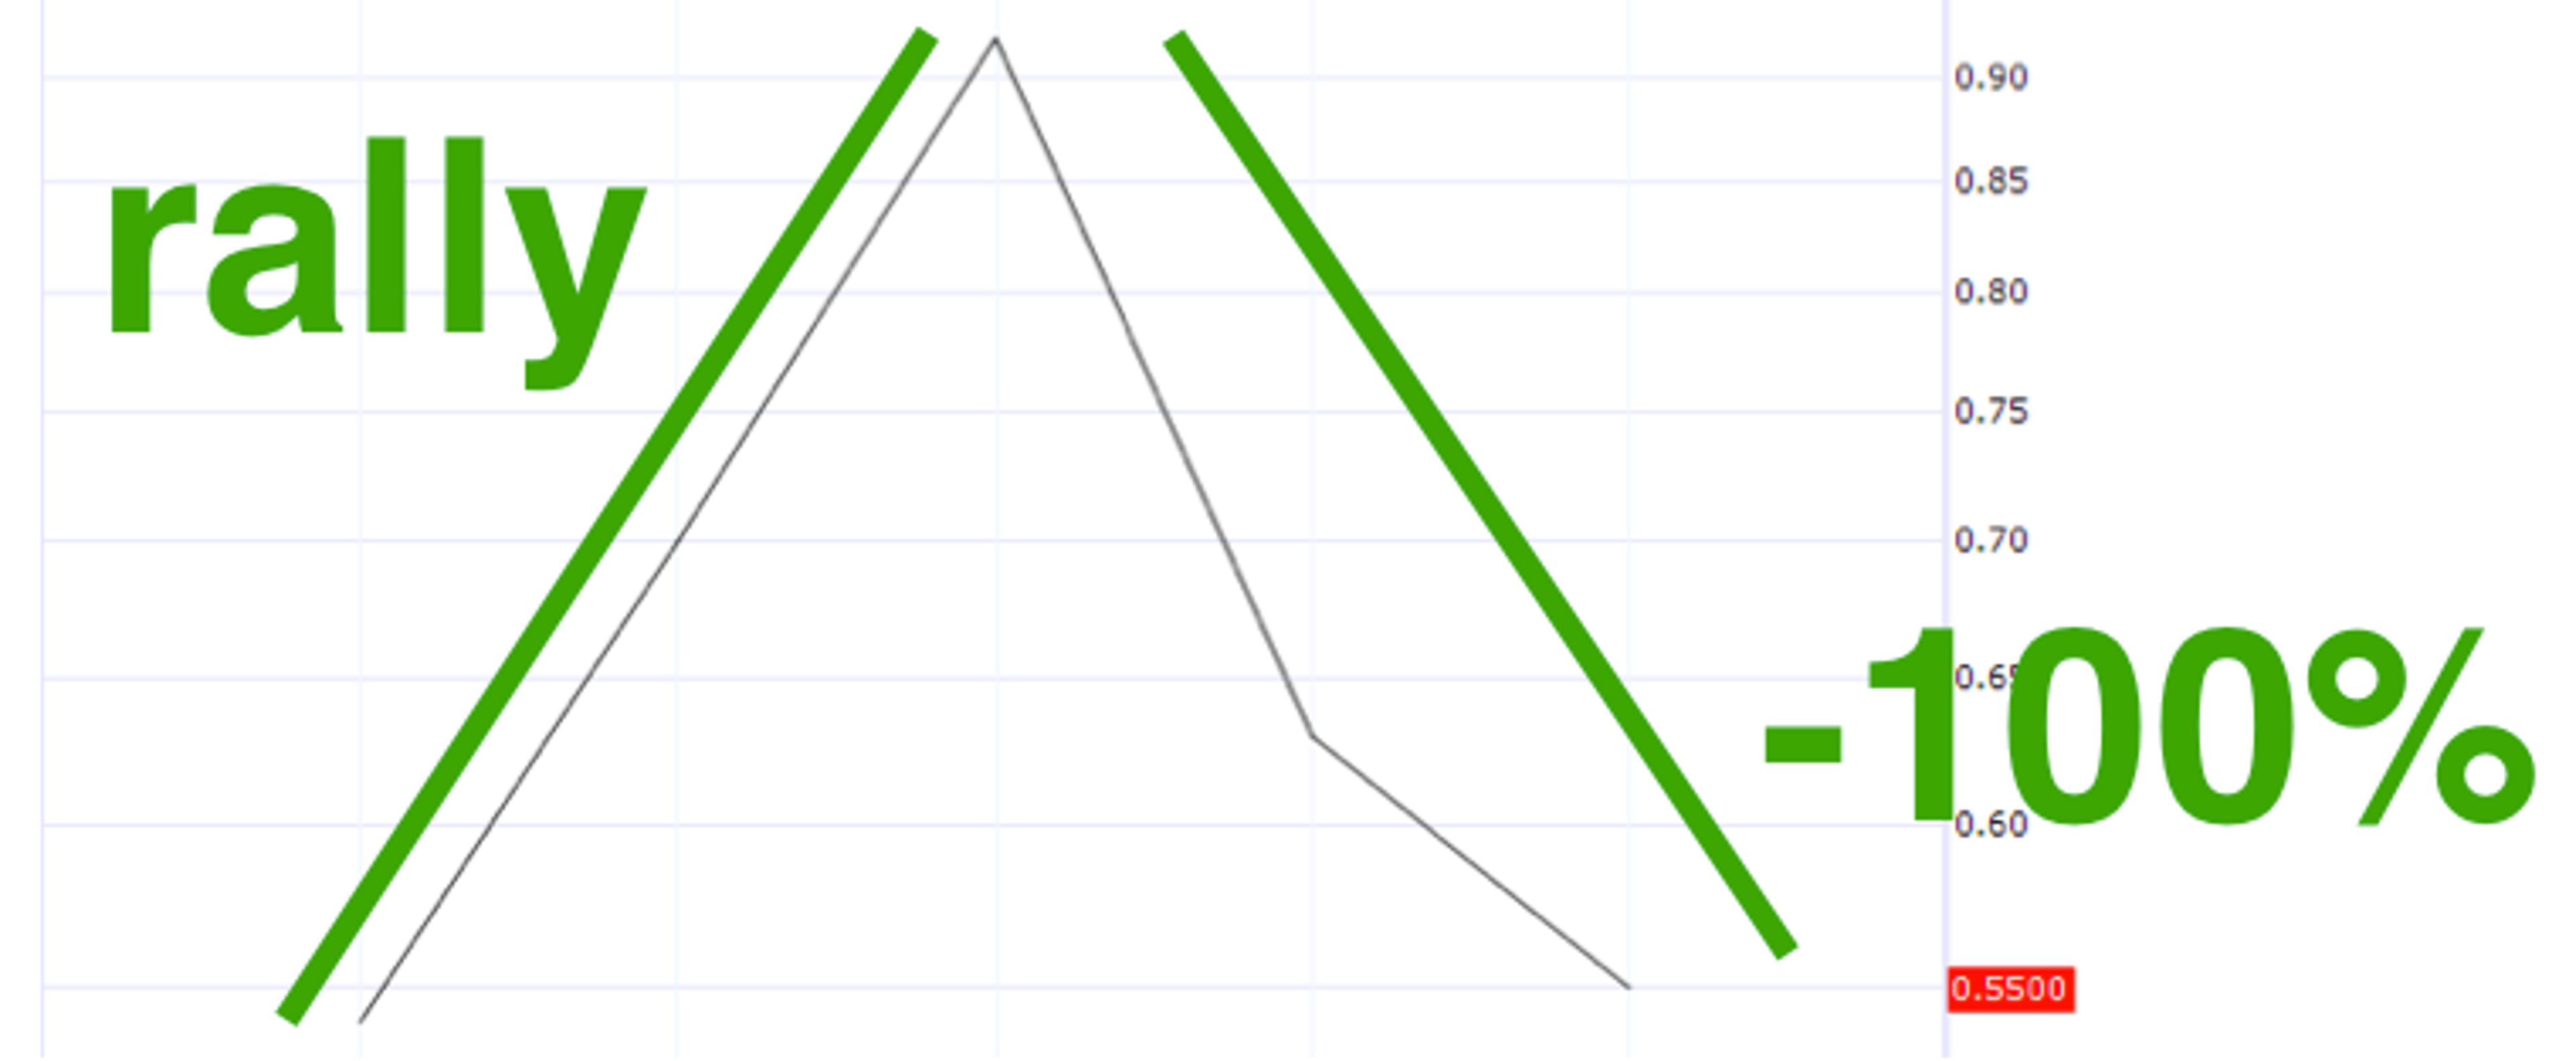
* 100% of $0.38 (the height of the rally) = $0.38
* $0.93 (the highest price) - $0.93 (the 100% retracement) = $0.55
* $0.55 is the current price of Pershing Gold
*
Pershing Gold is at a 100% fibonacci support level within its recent rally.ConclusionFibonacci analysis remains a popular form of stock analysis among traders and investors alike. Although fibonacci retracement levels are typically integrated into a more holistic analysis of price performance or even fundamental analysis, fibonacci alone can be used as a starting point for investment decisions. At the end of the day, only an individual knows his or her risk profile and financial preferences and, therefore, how fibonacci analysis fits into that unique framework.
Loading...
Loading...
© 2024 Benzinga.com. Benzinga does not provide investment advice. All rights reserved.
Benzinga simplifies the market for smarter investing
Trade confidently with insights and alerts from analyst ratings, free reports and breaking news that affects the stocks you care about.
Join Now: Free!
Already a member?Sign in

