


The graphs below were produced by Capital Market Labs.
Kandi Technologies Group Inc KNDI has booming revenue, collapsing earnings and a huge price-to-sales ratio. In short, when earnings come out, Kandi must show increasing revenue (and positive forecasts), a steadying of gross margin percentage, and a clear plan of how and when to control selling expenses (which are booming right now).
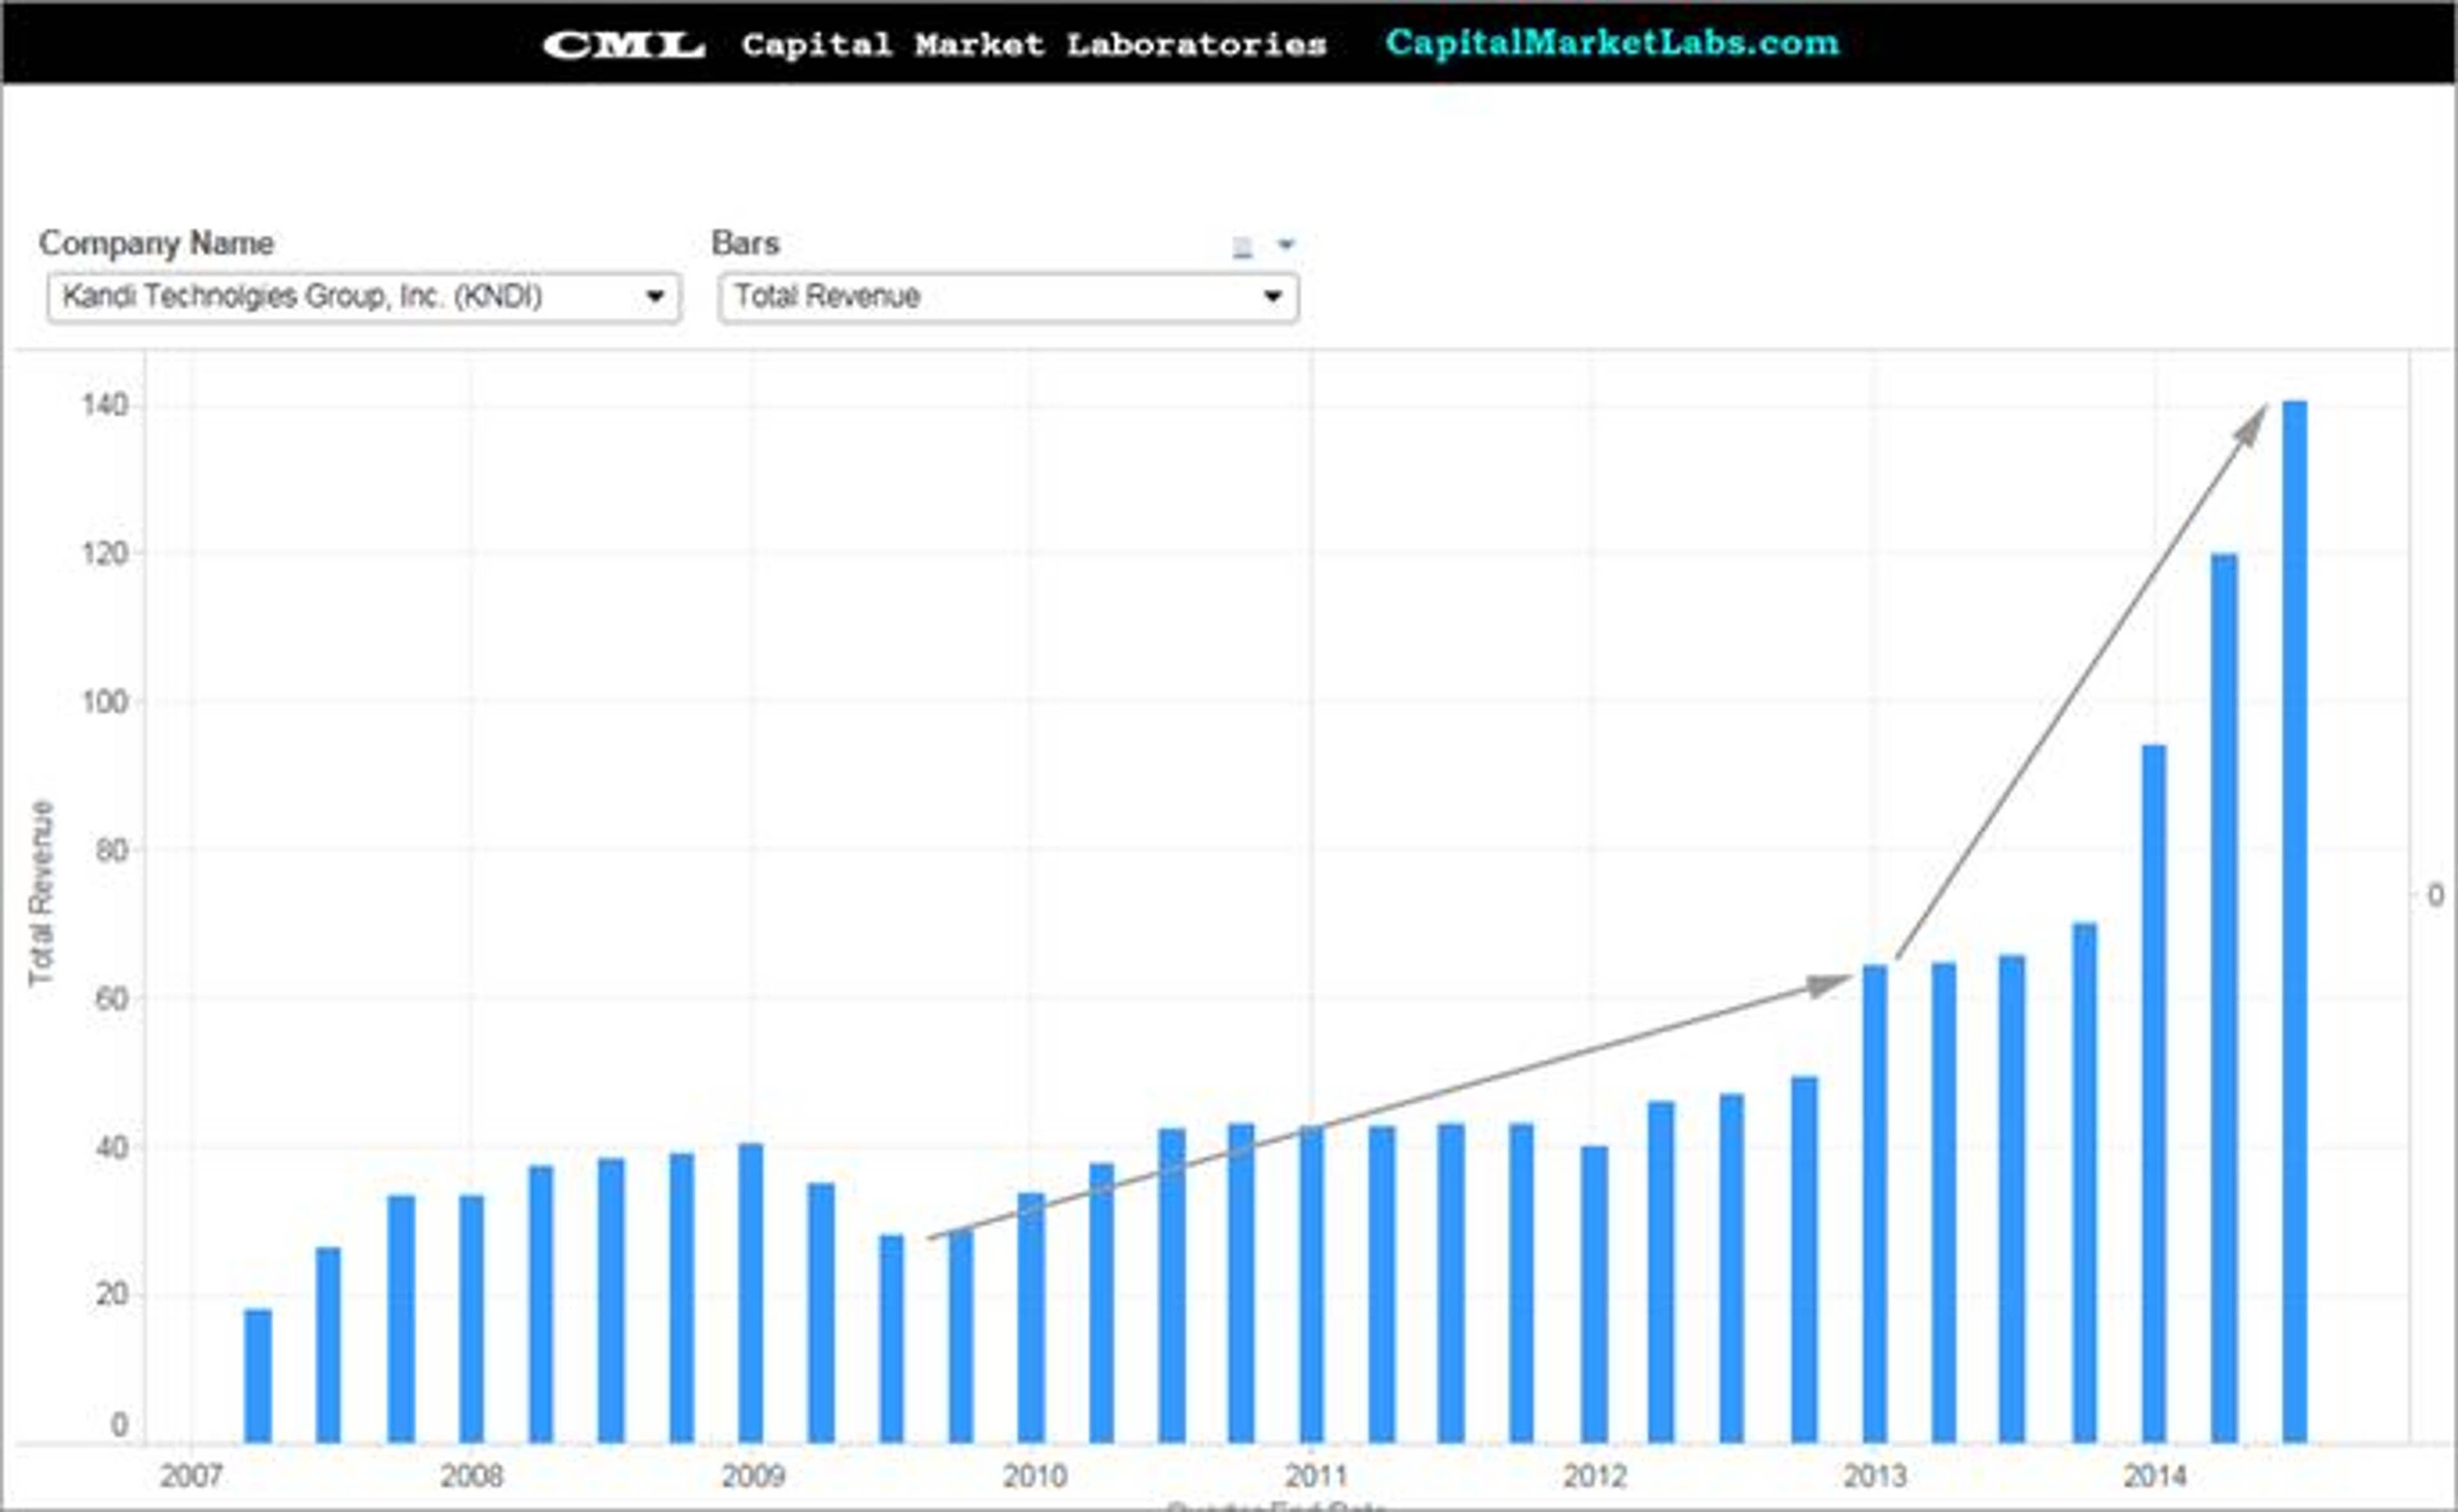
Total Revenue (TTM)
Up from $20 million to now over $140 million (trailing-twelve-months) in the last five years. This is the growth story.

Net Income Margin Percentage Vs. SG&A Expense / Operating Expense
It's hardly a needle in a haystack, but if one's looking for what's driving net income margin percentage down, it's simply an increase in selling, general and administrative expenses. This is actually a very normal place to see expense increases in a young firm, and of all places to see driving losses, this isn't the "worst." Much like R&D, it's an investment in branding and selling.


Watch for revenue growth and forecasts, as well as SG&A expenses, and investors will have a pretty complete picture of Kandi's stock price movement off of earnings.
Ophir Gottlieb can be found on Twitter @ophirgottlieb.
© 2024 Benzinga.com. Benzinga does not provide investment advice. All rights reserved.
Trade confidently with insights and alerts from analyst ratings, free reports and breaking news that affects the stocks you care about.

