


Last weekend I wrote about near-term caution flagsthat may bring some backing and filling for the S&P 500. No, it wasn’t a “run for the hills” piece, but rather a pragmatic case for proactive risk management: “Whether that pullback is 3-5 percent, or of greater variety, shouldn’t be of current concern. Right now the markets are still moving higher (not lower), so a proactive, protective approach is warranted within this context, especially for short term active investors like myself.”
I’m a big proponent of defining risk within trades (and timeframes). And since I write this article every week, I wanted to be sure that investors were aware of the near term caution flags I was seeing. Here were/are a few:
1)We were nearing new highs and markets typically don’t know what to do when they first poke their head into new territory. This was evidenced by the S&P 500′s move to new 4 year highs this week followed by a quick retreat.
2)Indices like the Bank Index (BKX) and the Russell 2000 (RUT) hadn’t shown strong follow-through to the upside yet. Note they will get there chance over the next couple of weeks.
3) Some major indices were in technical rising wedge patterns and the S&P 500 and Nasdaq 100 had recently recorded weekly sell setups – now 2 full weeks in. Note both reacted to the downside this week so follow through will be key for the bears. No follow through would equate to a short-term victory for the bulls. As well, the Nasdaq 100 fell out of its rising wedge but quickly rebounded Friday beneath its uptrend line – to be monitored this week.
So, where are we now? Well, so far we’ve seen just a two percent pullback from the highs. Will this be enough to recharge the bulls for another run higher? Or is S&P 1390 or 1375 in the cards for this week? Note that these are current support levels, with the latter being a must hold support.
Below are updated hourly, daily, and weekly technical bar charts for the S&P 500 as well as daily charts for the Nasdaq 100 and corollary indices like the US Dollar, the Volatility Index, and the Bank Index.
A market summary… In Pictures.
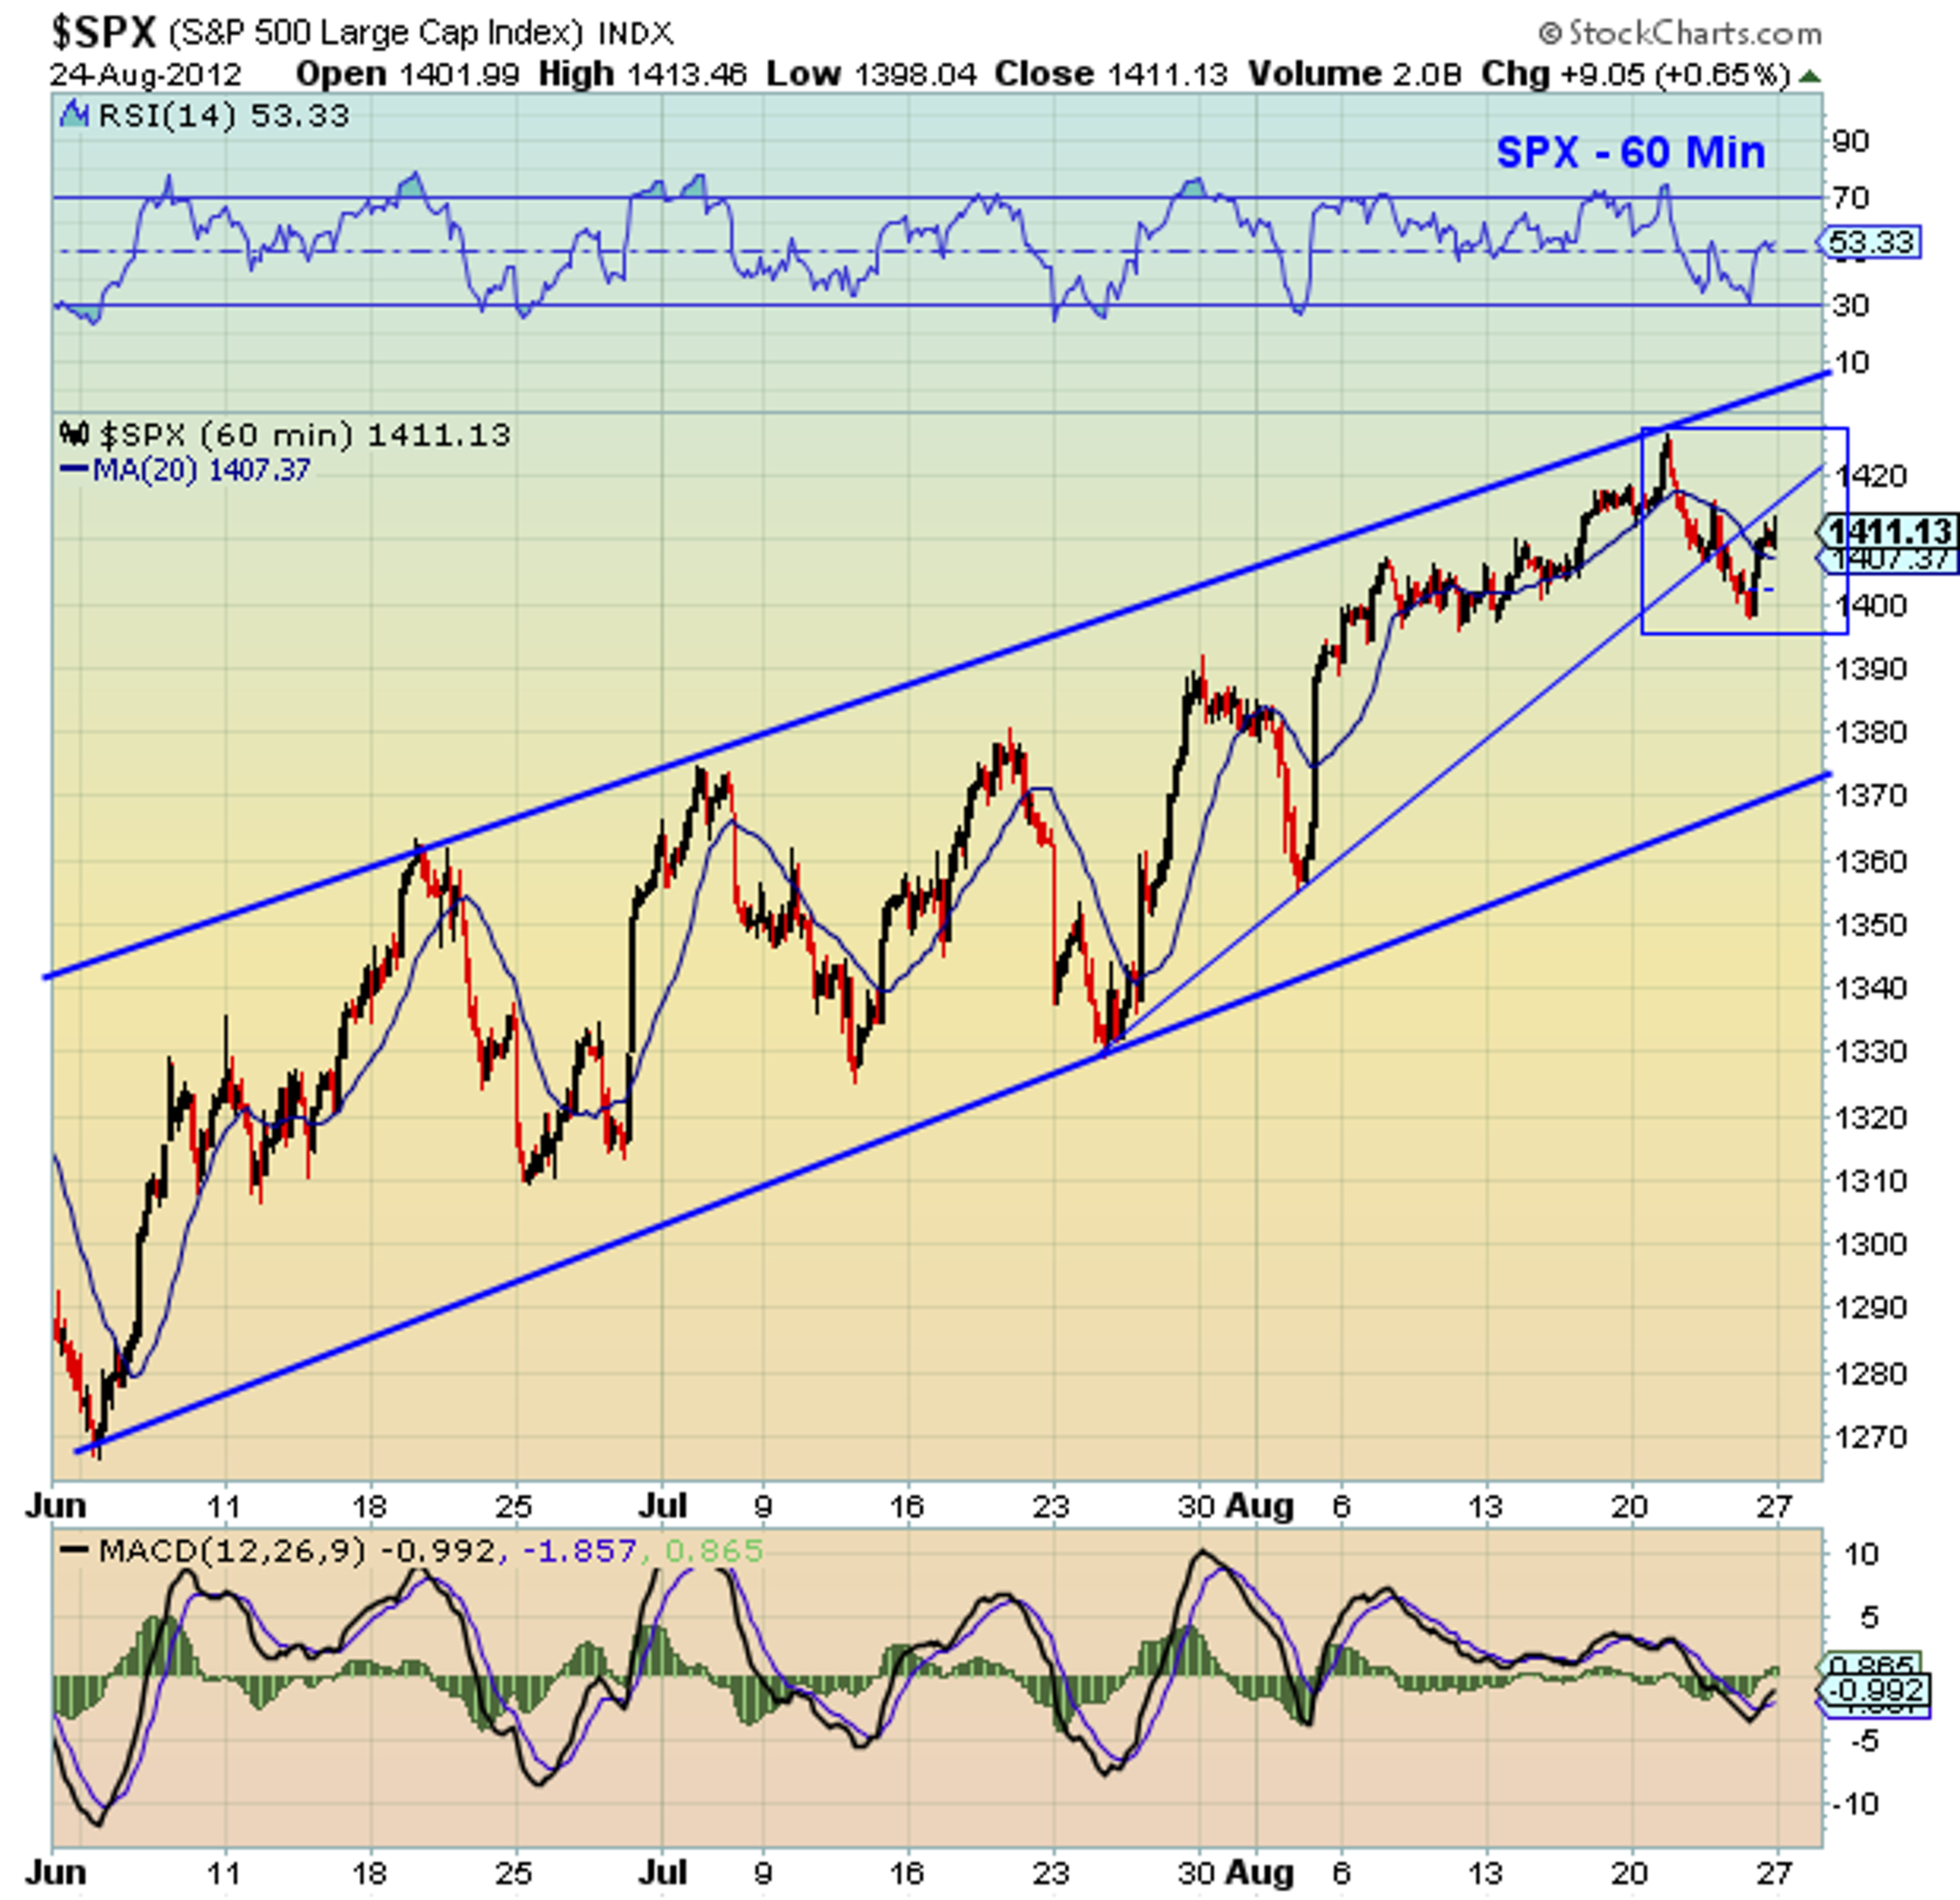
S&P 500 hourly bar chart:

S&P 500 Daily Bar Chart:


S&P 500 Weekly Chart:

Nasdaq 100 Daily Bar Chart:

Bank Index Daily Bar Chart:

US Dollar Daily Bar Chart:

Volatility Index Daily Bar Chart:


Have a great week ahead. Remember to trade safe and trade disciplined.
This article was originally published on investing and economics website, See It Market.
Twitter: @andrewnyquist @seeitmarket
No position in any of the securities mentioned at the time of publication.
Any opinions expressed herein are solely those of the author, and do not in any way represent the views or opinions of his employer or any other person or entity.
© 2024 Benzinga.com. Benzinga does not provide investment advice. All rights reserved.
Trade confidently with insights and alerts from analyst ratings, free reports and breaking news that affects the stocks you care about.

