


Loading...
Loading...

( click to enlarge )
Shares of Zalicus Inc ZLCS could be in the early stages of a technical breakout. The stock closed right at its 200 day MA on the daily chart on heavy volume. Although recently the stock has been on a pull back today's 19.75% gain to $1.10 per share shows the stock may be on the rise again. The technical chart looks like it's set up and ready to go. I will be watching very closely for news. ZLCS looks like it wants to run.
( click to enlarge )
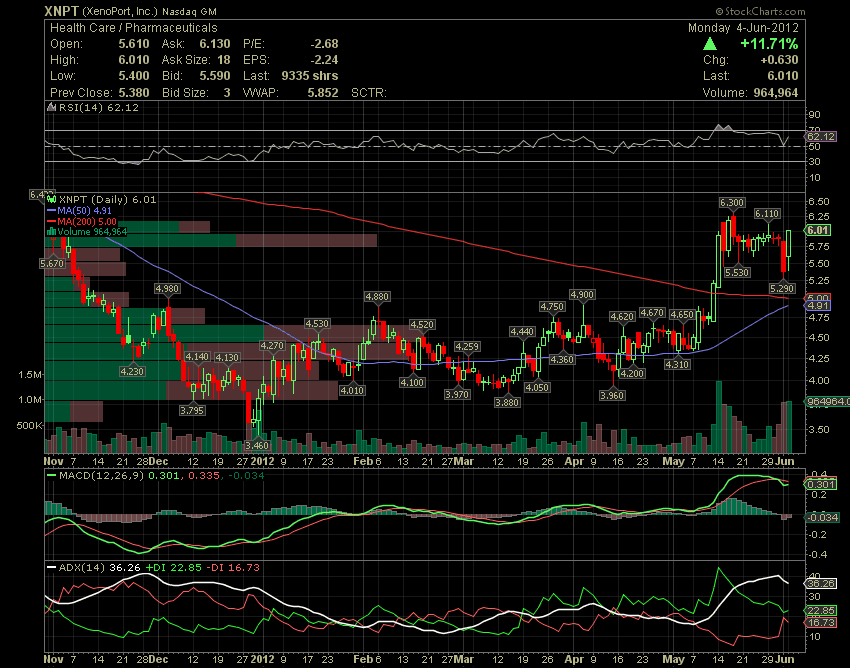
XenoPort, Inc. XNPT closed back over the psychological level of $6 and the volume was good. It looks like an upside breakout is imminent as the stock completely turned around from Friday's negative price action. The immediate support level is now adjusted to $5.53 followed by $5.29 and the resistance continues to be located at $6.11 followed by $6.30.
( click to enlarge )
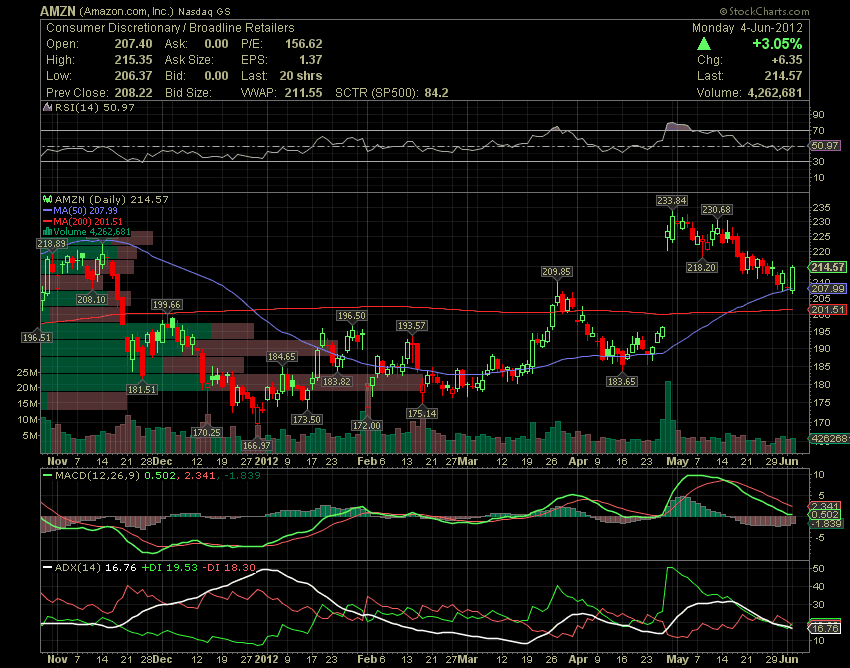
Amazon.com, Inc. AMZN had a nice reversal today, so I look for further upside. Target 220 and then 230. The chart is showing bullish sign as 50-day MA has crossed on top over 200-day MA and form Golden Cross, a bullish signal recently. Although the stock has been on pull back, with MACD still above zero, we should see AMZN going up again soon as ROC is showing stock is oversold.
Loading...
Loading...

( click to enlarge )
Zynga Inc ZNGA broke support and made a new 52-week low. The stock can continue going down, because there is no supports below. Unless the stock can recover above $6 again, the technical outlook for the stock will be bearish and you should reduce your exposure. Hard to say how far down it will go, since that depends on the strength of any selling.
During the day I tweet many times to my readers. I encourage everybody to subscribe AC Investor Blog twitter and newsletter, so you can receive my trade ideas and stock news in real time.


Loading...
Loading...
© 2024 Benzinga.com. Benzinga does not provide investment advice. All rights reserved.
Posted In: Trading Ideas
Benzinga simplifies the market for smarter investing
Trade confidently with insights and alerts from analyst ratings, free reports and breaking news that affects the stocks you care about.
Join Now: Free!
Already a member?Sign in

