


Loading...
Loading...
( click to enlarge )
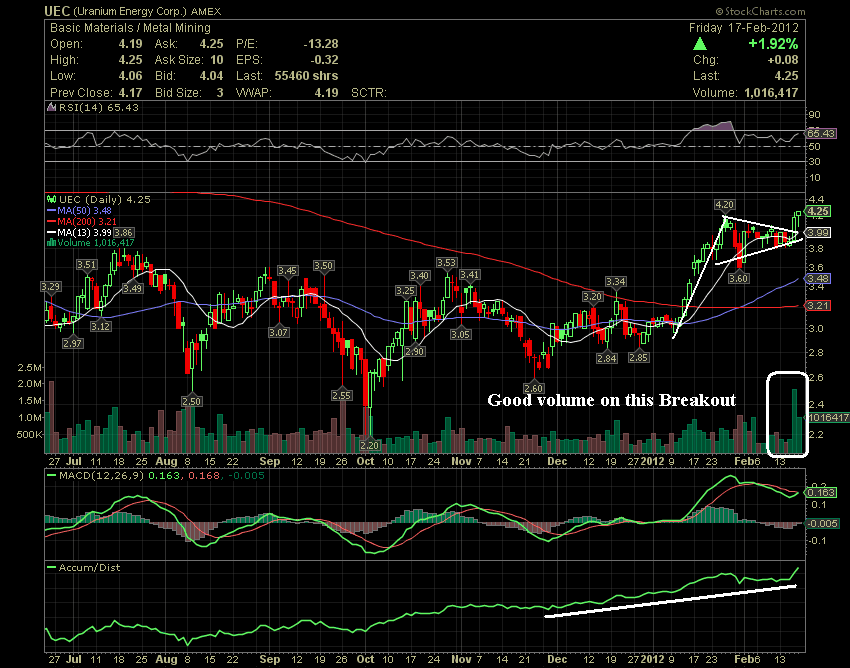
I like this chart on Uranium Energy Corp.UEC alot . Prob one of my Favorites. As you can see the stock brokeout on highvolume Thursday and was able to keep this strength today, closing at the high of the day. I've seen this many times in the market and you know what the end result usually is ? Well it's alot of money. RSI is rising and we are not even in overbought territory yet. The Accumulation/Distribution shows that the stock continues to be under accumulation by institutional traders and money managers. A break of 4.25 would confirm continuation of the trend, with a target area of 5.5 to 6. Watch it fly in the upcomming weeks. Lets make money !!

( click to enlarge )
Nice day for Intel Corporation INTC. I first alerted on this one yesterday night as a possible breakout candidate and this morning on Twitter I said the stock was on my watch radar. The stock did what it was supposed to do and was one of the big winners on Friday, closing up 55 cents on the day. This was a good run for those who jumped in at that time. The stock broke out of a consolidation that has been a pause in its steep, more than 10% up move in January. INTC traded heavy volume as it hit a high of $27.50. This high is resistance for Tuesday's continuation move. If the stock can break through this level, I expect to see another strong upside move.

( click to enlarge )
Loading...
Loading...
eBay Inc EBAY broke out and never stopped all day. There is a good chance the stock will continue to move up. If the stock can break through $35,21, we should see it move up to $36. Looking at the technical chart the investor sentiment in stock showed by "RSI" continues strong and MACD still going up. Technically speaking, the stock is painting a Bullish picture.

( click to enlarge )
The Home Depot, Inc. (NYSE:HD) hit a new 52-week high today, trading as high as $46.72 , before settling at a close of $46,71. I'll be watching the stock on tuesday, looking for a follow through move. As long as the stock stay above $45.45, the bullish scenario still intact. Technical chart shows very strong bullish sign. First, the stock is trading above both 50-day and 200-day moving average with both moving average pointing upwards. Then the MACD indicator is positive and KD line still show the stock is on the positive swing.
During the day I tweet many times to my readers. I encourage everybody to subscribe AC Investor Blog twitter and newsletter, so you can receive my trade ideas and stock news in real time.
Disclaimer : This is not an investment advisory, and should not be used to make investment decisions. Information in AC Investor Blog is often opinionated and should be considered for information purposes only. No stock exchange anywhere has approved or disapproved of the information contained herein. There is no express or implied solicitation to buy or sell securities. The charts provided here are not meant for investment purposes and only serve as technical examples. Don't consider buying or selling any stock without conducting your own due diligence.
Thanks for visiting AC Investor Blog.
AC


Loading...
Loading...
© 2024 Benzinga.com. Benzinga does not provide investment advice. All rights reserved.
Posted In: Trading Ideas
Benzinga simplifies the market for smarter investing
Trade confidently with insights and alerts from analyst ratings, free reports and breaking news that affects the stocks you care about.
Join Now: Free!
Already a member?Sign in

