


Benzinga’s Securities Lending Volatility Index (SLVX) Powered by Tidal Markets, is an indicator that forecasts stock market activity for broader indices and individual securities.
To demonstrate the use of the SLVX as a stock market indicator, we show how changes in the SLVX predicted a -5.46% decline in Tata Motors Limited towards the end of April 2019.
Tata Motors Limited TTM designs, manufactures, and sells a range of automotive vehicles, including cars, sports vehicles, trucks, buses, and defense vehicles.
At the end of March, TTM experienced a strong price rally by gaining 40.50% over the span of nearly three weeks of trading between March 27th and April 18th.
As TTM began its rapid ascent throughout the early weeks of April, the SLVX showed a quick uptick in parallel, indicating that the stocks sudden market rally may be overstated.
To put it into perspective, the SLVX levels of TTM averaged a calm 1.65 throughout 1Q19, with the SLVX reaching a level of 4.07 on only one day, February 7th, when the stock was in the midst of a decline, losing -19.79% over 3 trading days between February 6th through the 8th. Otherwise during the first quarter of the year, SLVX values of TTM had maintained little to zero volatile activity.
On the first day of our analysis, 4/10/2019, the SLVX reflected a volatility rate of 1.71, but suddenly as TTM started to rise beginning on April 11th and for the proceeding 7 trading days, the SLVX increased by 165.86%, denoting a strong uptick in volatility.

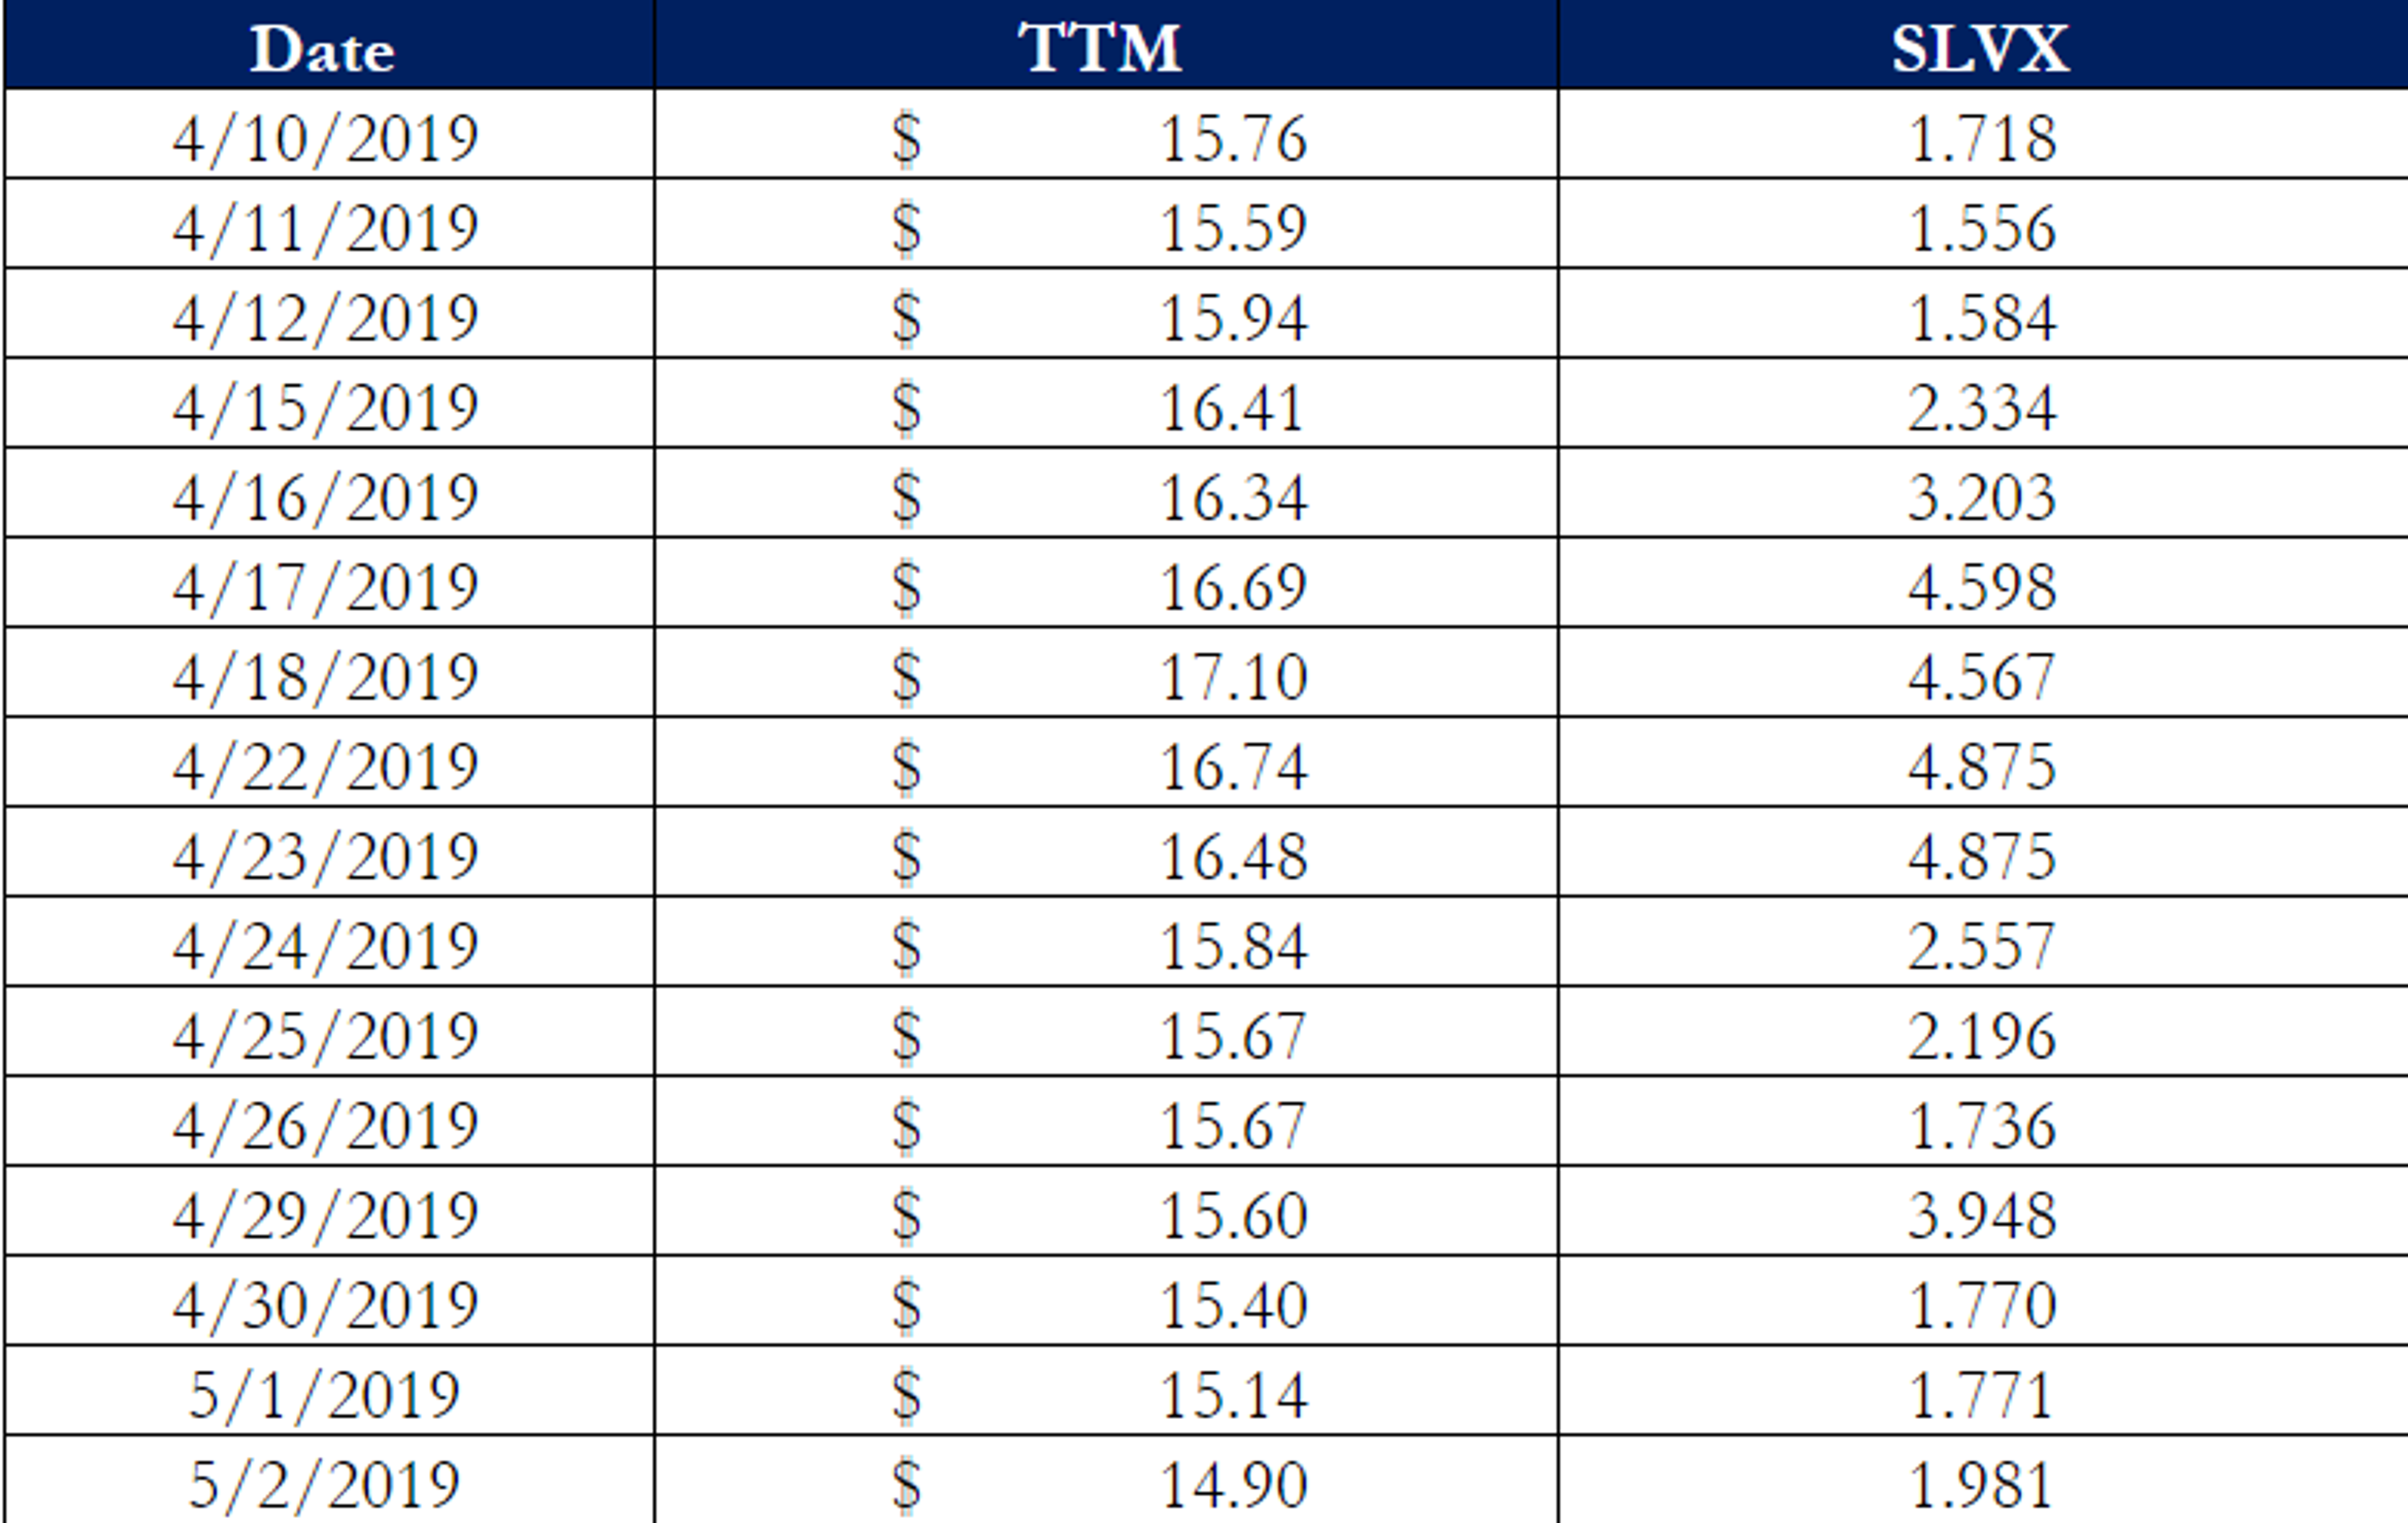
Figure 1
Figure 2


Between April 10th and April 18th as the SLVX rose 165.86%, the share price of Tata Motors gained 8.50%, or $1.34 per share. On April 18th at the stocks peak of $17.10, TTM fell -9.61% over the following six days as predicted by the SLVX.
Just as shares of TTM appeared to plateau on April 29th, the SLVX quickly spiked one last time, before TTM declined another -4.69%, for a total of -14.76% decrease in value from peak-to-trough in nine days of trading, ending May 2nd, 2019.
As we continue to watch SLVX values of TTM into the early weeks of May, we’ve seen volatility values jump back up over 130%. If the SLVX continues to remain high for TTM and there are any signs of history repeating itself, it’s likely we’ll see the share price of Tata Motors continue to decline.
Image sourced from Google
© 2024 Benzinga.com. Benzinga does not provide investment advice. All rights reserved.
Trade confidently with insights and alerts from analyst ratings, free reports and breaking news that affects the stocks you care about.

