


Alphabet Inc GOOG GOOGL is at the forefront of practically every industry of the future. With that in mind, we should all pay attention to what they are doing and saying regardless of any investment interest. For example, they mentioned that their self-driving unit called Waymo has hit 5 million miles driven. At first glance, this seems like a large number, but 5 million miles is the equivalent of 19 cars driving 35 MPH around the clock non-stop for a year.
That's not that much in my view if anyone is truly considering getting into a car where they are not in control. I am still under the view that we are a decade away from any sort of real level 5 autonomous vehicle capabilities/acceptance (that could be for another discussion post). With that here's a couple charts.
Google Likes Humans Too

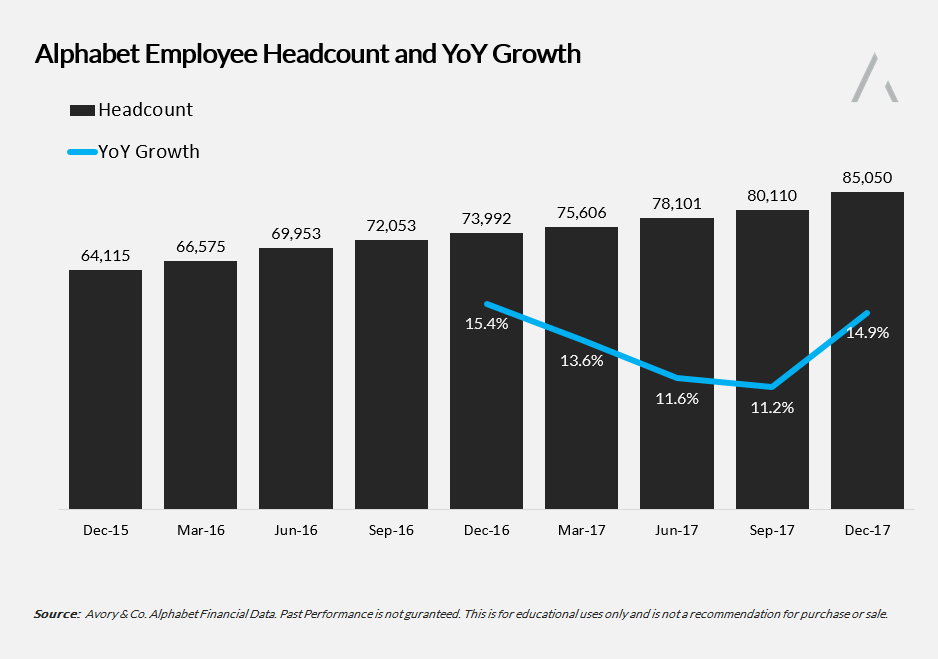
Google saw an acceleration in hiring this quarter, growing headcount by 14.9% year-over-year. With an increase of over 5,000 employees from the prior quarter, this was the largest quarter on quarter unit growth since 2012. The driver in hiring is clearly what is going on with the improper use of targeted ads across media, along with the growth in their "other revenues".
Moving From Ads

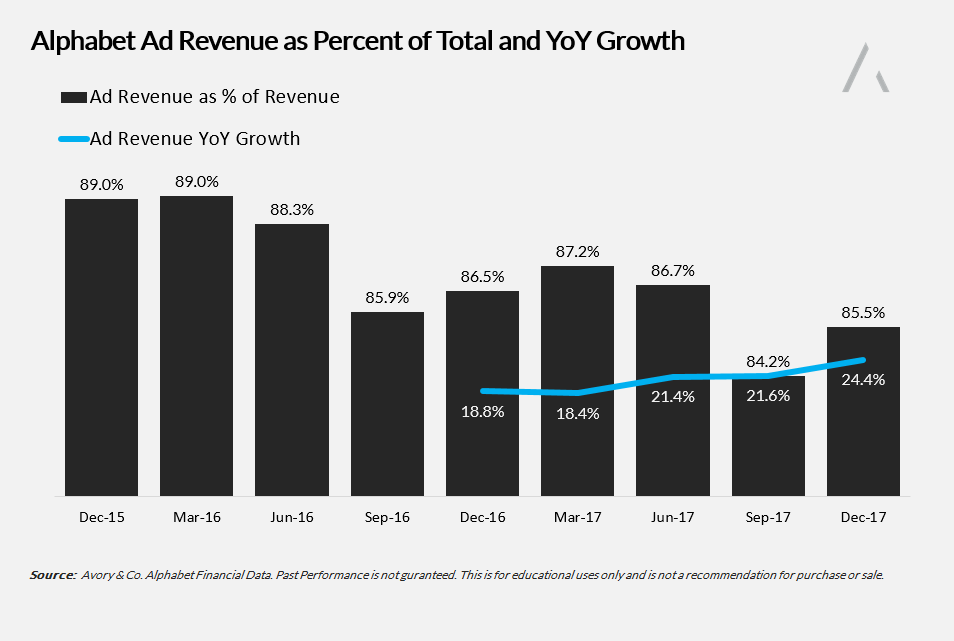
Google is making strides in diversifying away from its core ad revenue business. Google's "other revenue" category hit $4.3B in revenue during Q1 alone. This "other revenue" line is made up of apps, Google Play store, cloud offerings, digital content, and hardware. For sizing comparison, Netflix's entire business hit $3.7B during their Q1.
While I understand Netflix and Google's "other revenue" have no relationship, its stands to emphasize that Google's side business is a big business, and growing double digits. With that said, Google's ad business remains 85% of total gross revenues, which is down from nearly 90% in 2016. I wanted to add that it is not that Google cannot diversify itself, it is that their core ad business is still growing 24%. Something I think the naysayers are getting wrong.
The Entire Picture

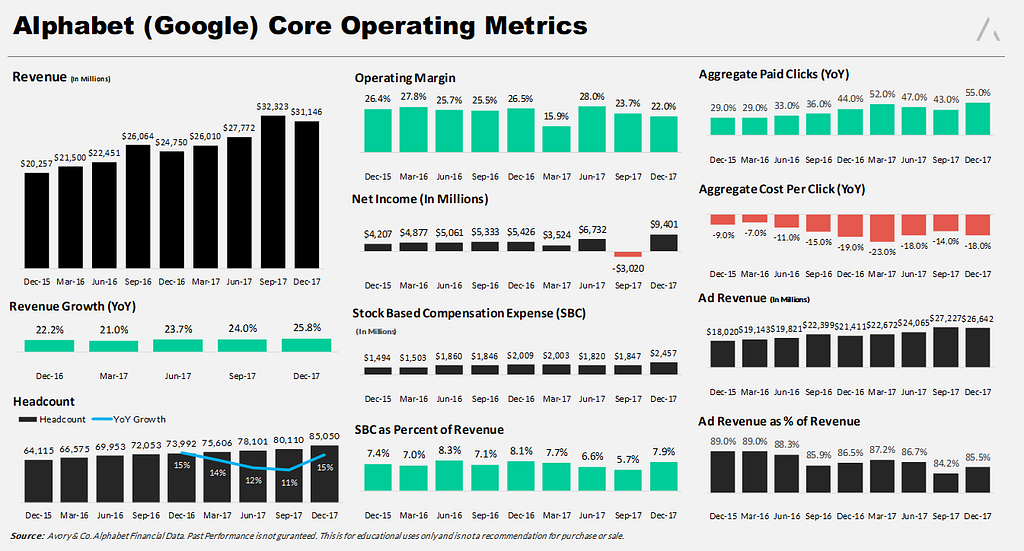
Here's a chart of charts and probably best viewed on a computer, despite mobile device usage. One figure you do not see here is their $6.3 billion (TAC) total acquisition cost, which was 24% of ad revenue revenue, up from 22% a year ago. As search continues its trend towards mobile, the TAC is expected to stay elevated before leveling out as usage matures.
Overall revenue increased 26%, helped by a 3% currency lift. I have been talking about currency tailwinds for this earning season for a while now. See Benzinga piece last week as an example. The Google press release implies a re-acceleration of growth, but the currency lift is the misleading factor. Currency neutral, it was a slight deceleration in revenue from Q1 2017 (24% annual growth) to Q1 2018 (23% annual growth).
Those are still really strong top line numbers for a company this size. Overall, the numbers are strong, and new business lines for Google are growing fast. This was a solid barometer for technology heading into the thick of earnings season.
Disclaimer: This is not a recommendation for purchase or sale of any securities.
Avory & Co. Is A Registered Investment Adviser. Information Presented Is For Educational Purposes Only. Please See Full Disclaimer Here
© 2024 Benzinga.com. Benzinga does not provide investment advice. All rights reserved.
Date | ticker | name | Actual EPS | EPS Surprise | Actual Rev | Rev Surprise |
|---|
Trade confidently with insights and alerts from analyst ratings, free reports and breaking news that affects the stocks you care about.

