


This was an eventful week for investors of big tech names such as Amazon.com, Inc. AMZN, Google Inc GOOG GOOGL, Facebook Inc FB, Apple Inc. AAPL and Alibaba Group Holding Ltd BABA.
After a mixed bag of earnings reports, how to the big names now compare from a fundamental standpoint?
Earnings
One of the most basic fundamental metrics for gauging a stock’s value is the price to earnings ratio (PE). The lower the PE, the higher the value. Here’s a breakdown of the updated PE for these five big names.

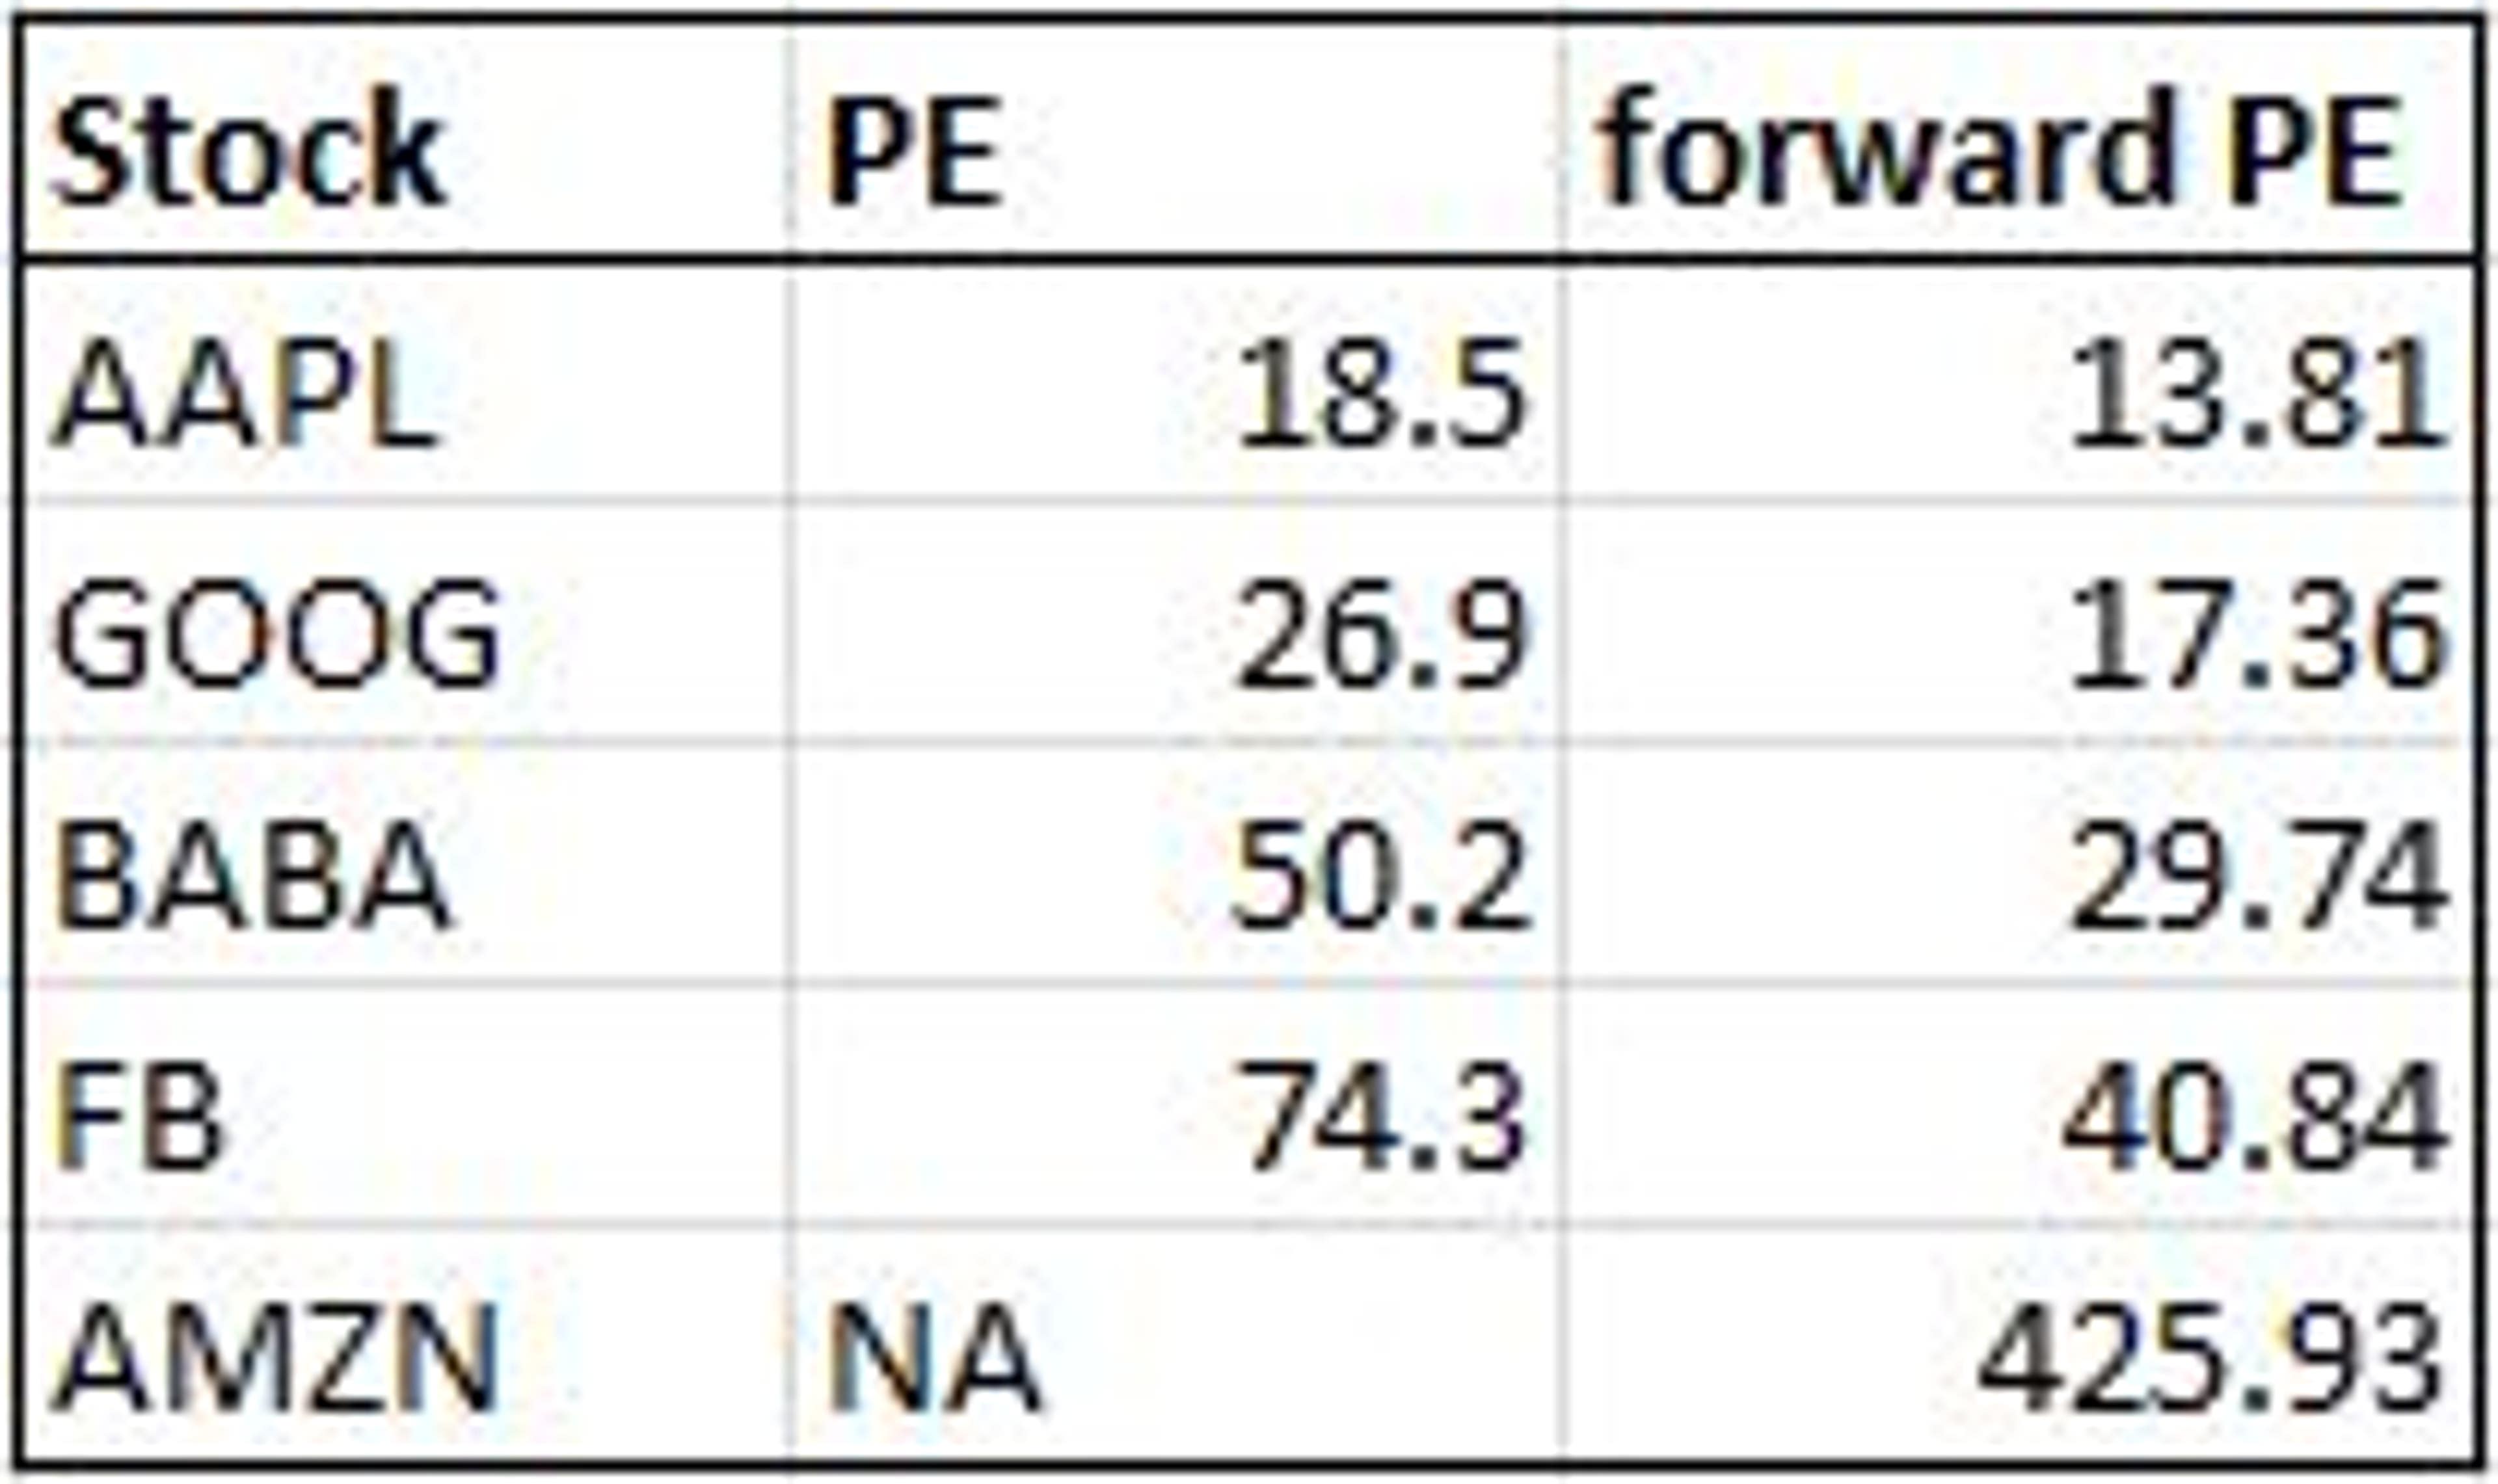
Apple is currently the only stock of the five with a PE lower than the S&P 500’s overall PE of 18.9. Alibaba and Facebook’s PEs of over 50 are well out of the normal range for the S&P 500. Amazon is the only company that was not profitable in 2014 (and therefore has no PE).
Apple still leads the group with a forward PE of 13.8, but Google’s forward PE of 17.3 puts it well within the historical average range for the S&P 500. Facebook’s forward PE of 40.8 is still fairly high, and Amazon’s number of 425.93 is extremely high.
Growth
However, price is not everything.
Growth rate is also critical for companies that are rapidly increasing their bottom lines. The price to earnings to growth ratio is a good way to look at how expensive a stock is relative to its growth rate. Here’s a comparison of the PEGs of these five names.
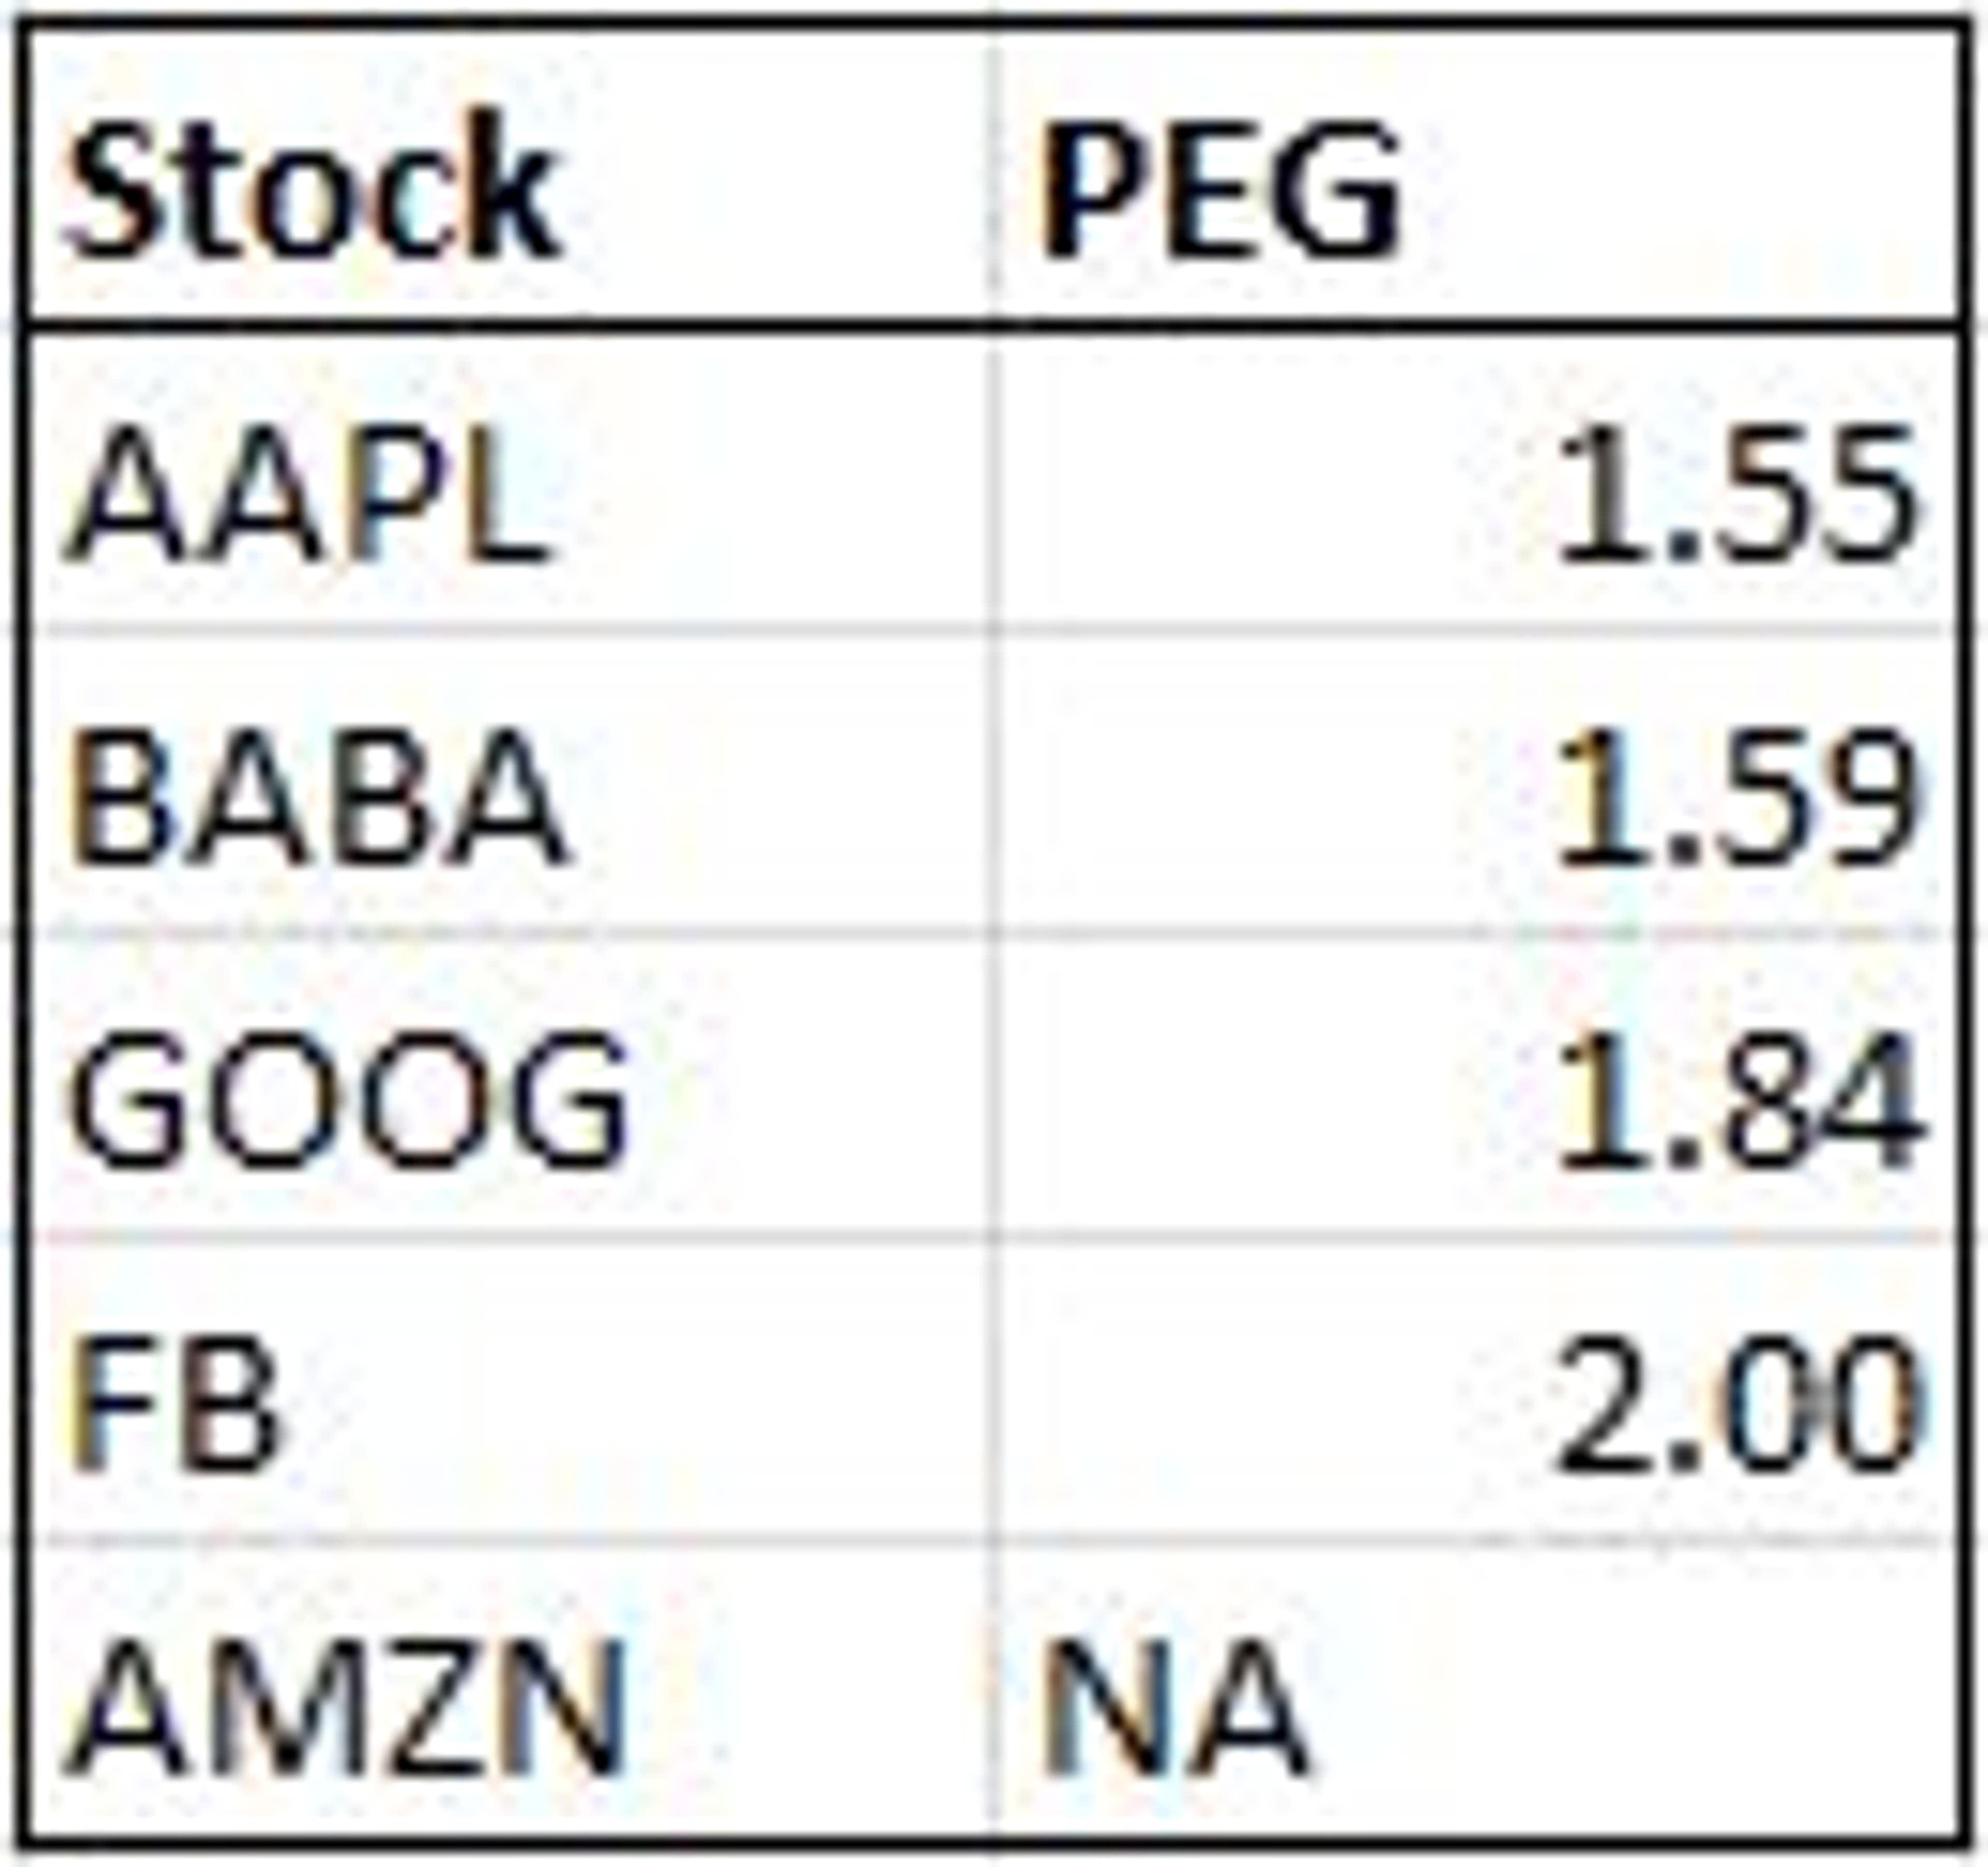
The current PEG of the S&P 500 is 1.5, so Apple and Alibaba are very close to average. Google and Facebook have relatively high PEGs, and Amazon’s PEG cannot be calculated from negative earnings.
Cash Flow
Sometimes when companies reinvest a majority of earnings for the purpose of expanding operations and growing the company, earnings numbers aren’t the best measure of a stock’s value.
Instead, investors may choose to focus on cash flow from operations, a measure of how much cash a company brings in from regular business activities. Here is the price to cash flow from operations ratio for each of these five companies.
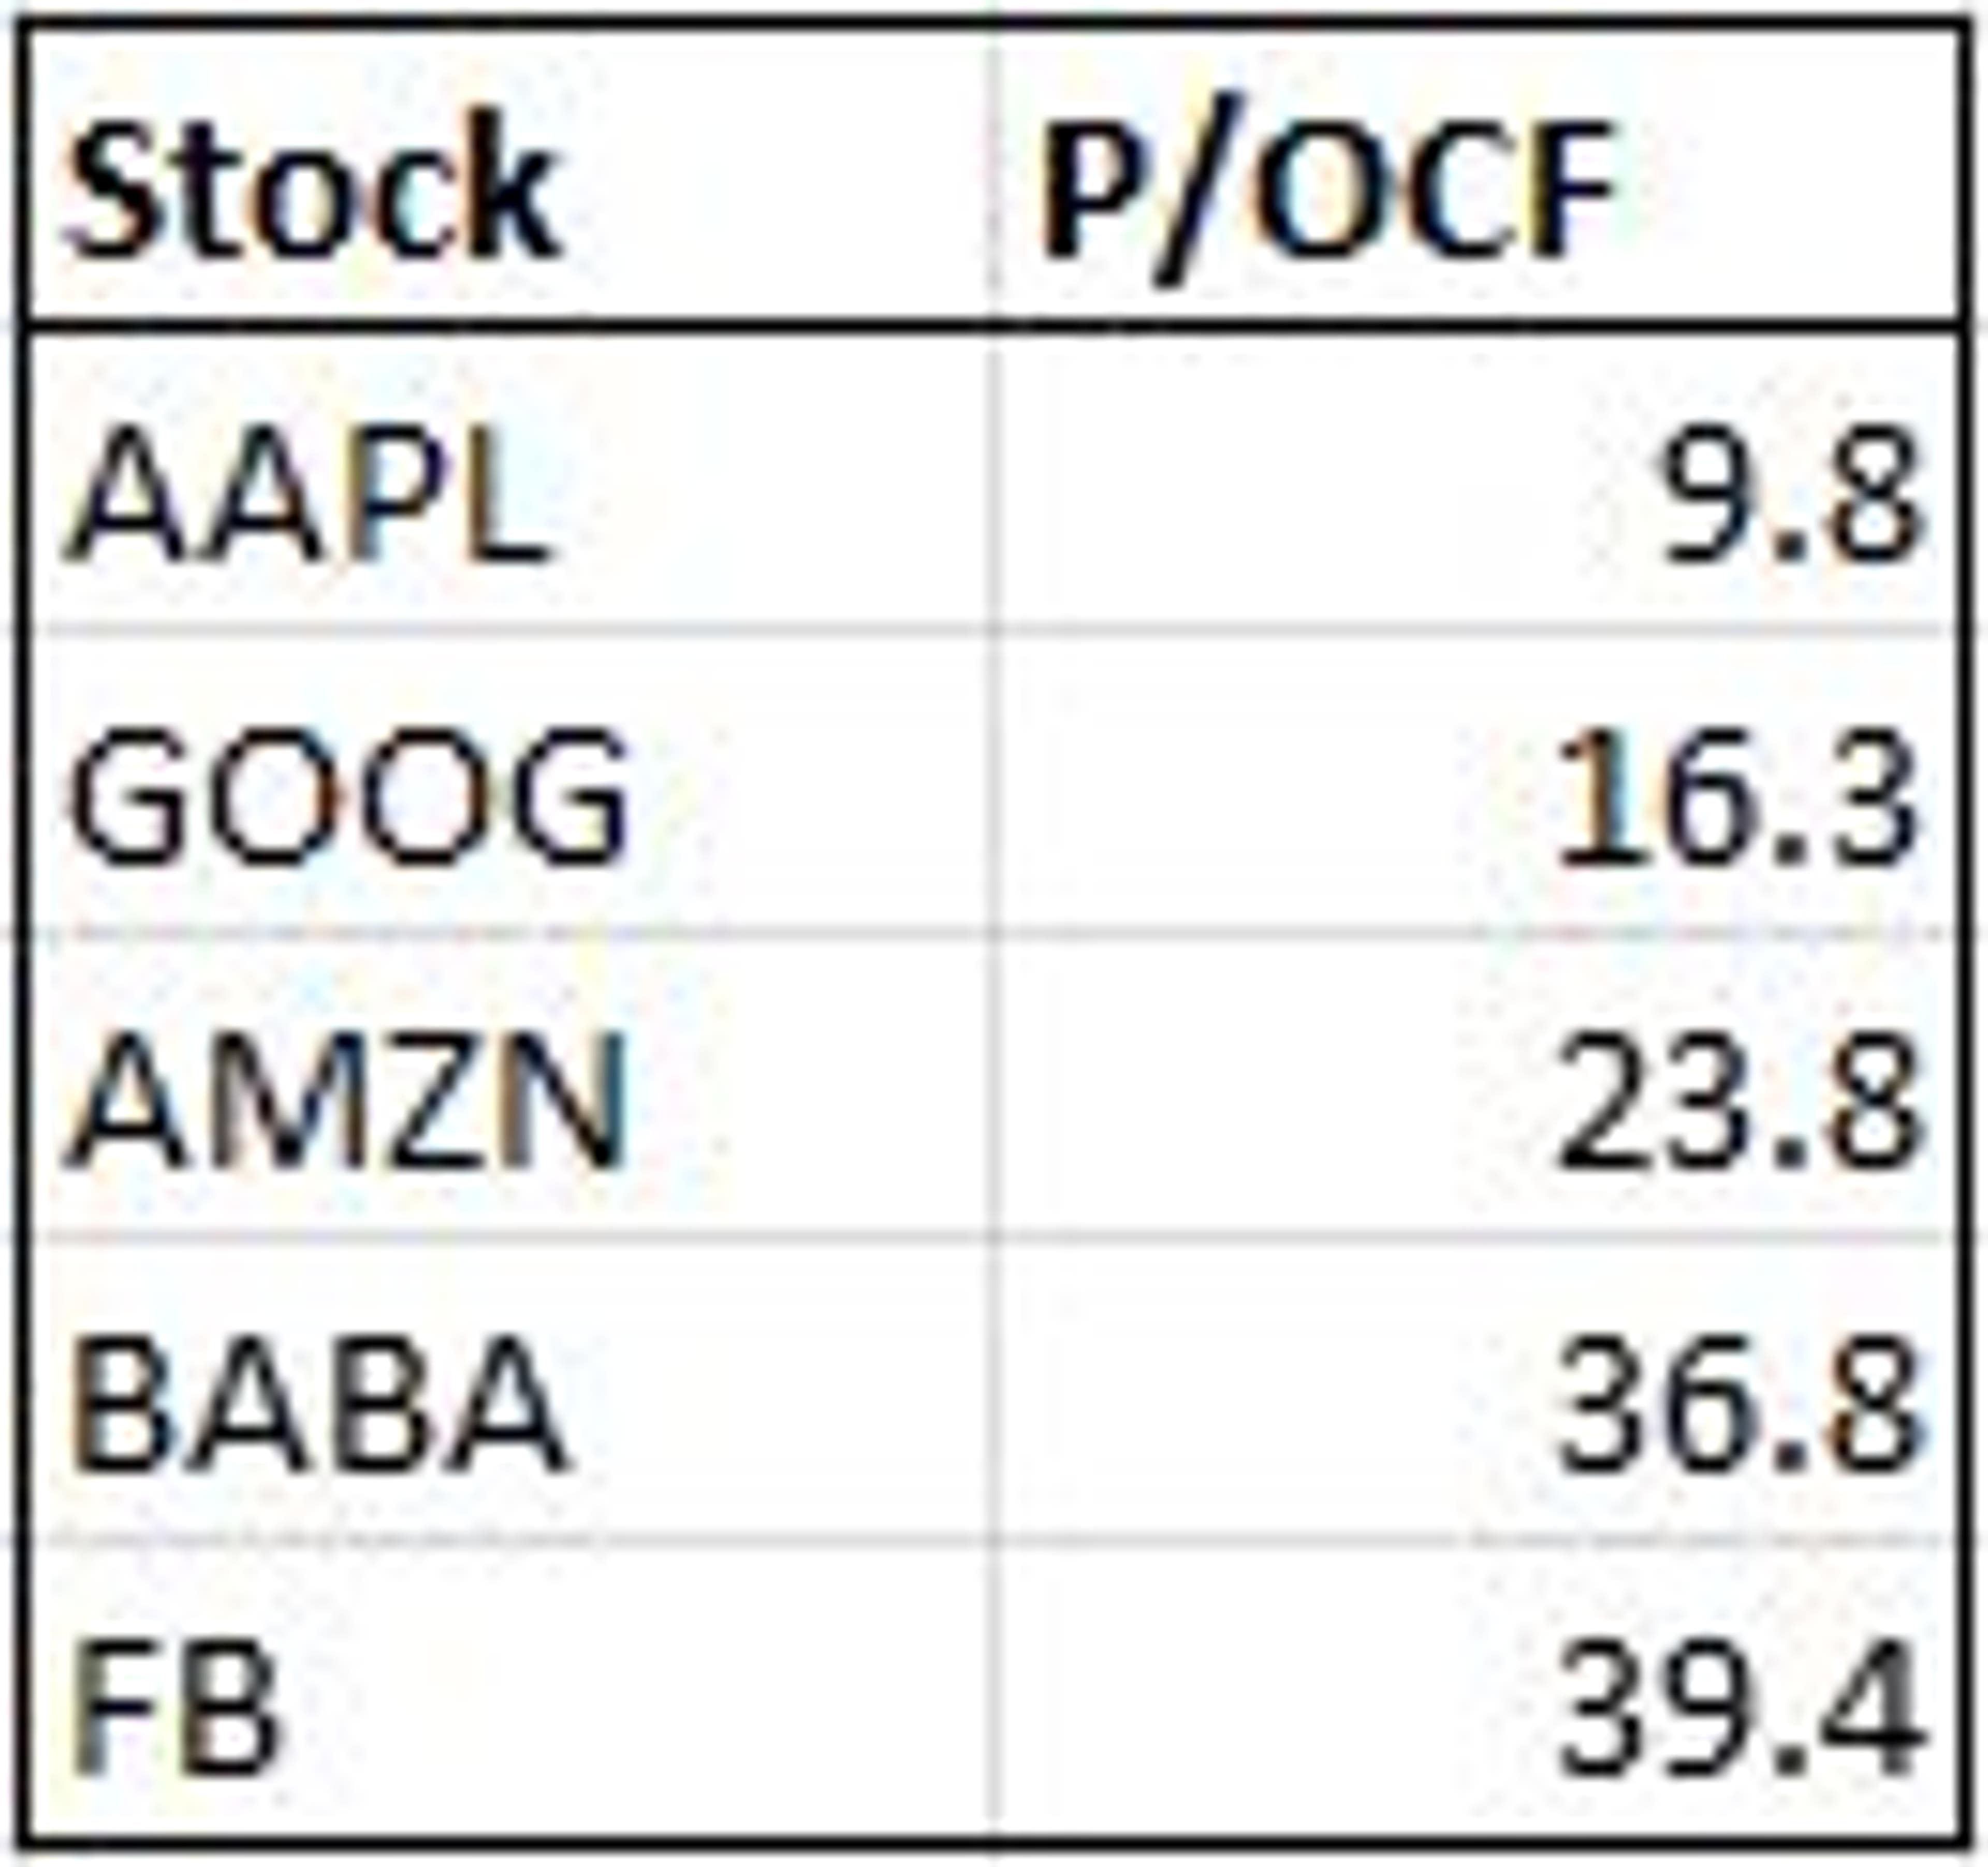
Once again, Apple and Google lead the way in the group with their massive cash flows.
This time, Alibaba and Facebook take the bottom two slots.
Takeaway
Nobody knows exactly what 2015 holds for these five tech giants.
However, now that the dust has settled on a busy earnings week, the market can begin to get a clearer picture of how these companies stack up from a fundamental perspective.
Disclosure: the author holds a short position in Amazon.
© 2024 Benzinga.com. Benzinga does not provide investment advice. All rights reserved.
Trade confidently with insights and alerts from analyst ratings, free reports and breaking news that affects the stocks you care about.

