


- GBP/USD has been drifting downwards as the USD reasserts itself after the holiday.
- The US Non-Farm Payrolls is left, right, and center.
- Friday's four-hour chart is showing oversold conditions that imply a bounce.
GBP/USD may have finished reacting negatively to poor UK data – but is now succumbing to the strength of the US dollar. American traders are returning from their Independence Day holiday and await the all-important US Non-Farm Payrolls. The greenback is gaining ground ahead of the release.
Economists expect an increase of 160K jobs in June – more than double the disappointing rise of 75K seen in May. The expected return to normality has been dampened by leading indicators such as the ADP Non-Farm Payrolls and the ISM Non-Manufacturing PMI – both falling short of expectations. Bloomberg's "whisper number" stands at a moderate increase of only 120K. Wages are forecast to advance by 0.3% on a monthly basis and 3.2% year on year – 0.1% better than in May on both timeframes.
As mentioned earlier, UK data may have finished responding to the weak Purchasing Managers' Indices (PMIs) that have been implying stagnation in the British economy and risk of recession. However, the central bank has yet to react to the figures – and may send it falling later on. The prospects of a hard Brexit – that leading Conservative candidate Boris Johnson is open to – loom over Sterling. Additional comments from the former foreign secretary may weigh on the pound.
Overall, the US employment figures will likely shape the next moves, yet Johnson can always steal the show.
GBP/USD Technical Analysis

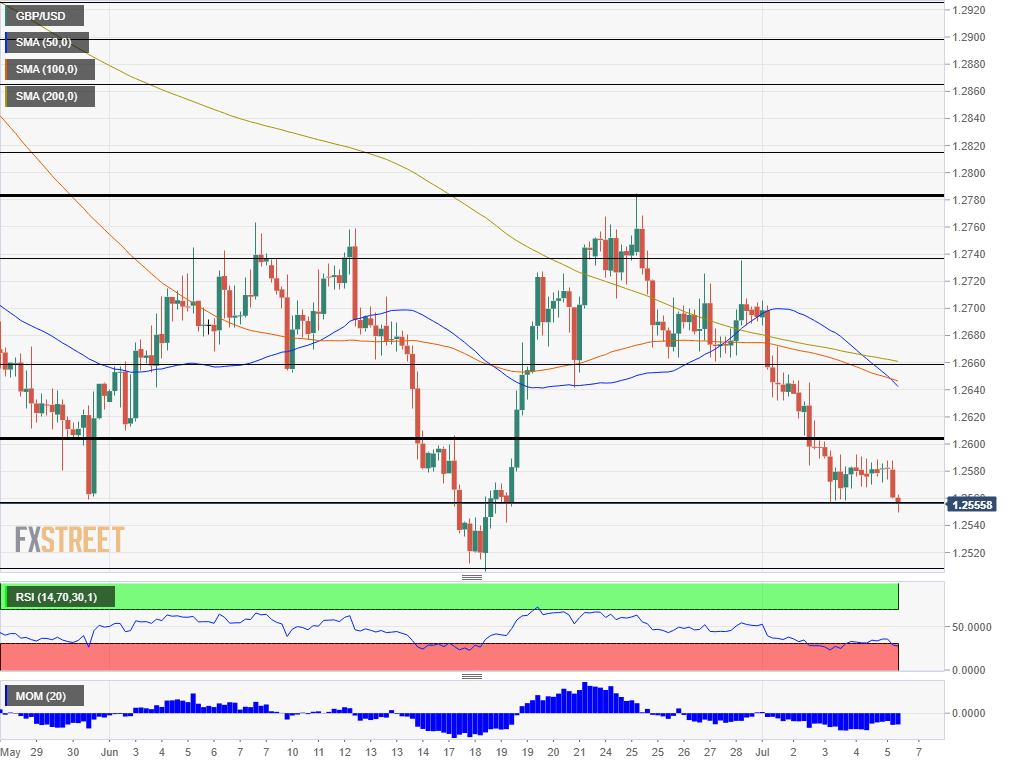
GBP/USD has dipped below 1.2558 – a critical support line that held up the pair earlier this week and was also May's trough. Despite falling to a two-week low, the Relative Strength Index (RSI) is standing below 30 – indicating oversold conditions – and implying an upside correction.
Nevertheless, downside momentum prevails and the 50 Simple Moving Average has crossed below the 100 and 200 SMAs – another bearish sign.
June's low of 1.2505 is a crucial support line. A break below this level opens the door to 1.2475, which provided support in December and 1.2475, the 2019 low.
Resistance awaits at 1.2605 which was a low point in May and capped GBP/USD also in mid-June. Further up, 1.2660 was a stubborn support line in late June, and 1.2740 was a swing high around that time.
© 2024 Benzinga.com. Benzinga does not provide investment advice. All rights reserved.
Trade confidently with insights and alerts from analyst ratings, free reports and breaking news that affects the stocks you care about.

