


- GBP/USD continues recovering, mainly on USD weakness.
- US data and Brexit-related news are set to dominate.
- The technical picture remains bearish for the pair.
GBP/USD is trading in the mid-1.2900s, extending its gains from the two-month lows of 1.2868 seen last week. The central driver is the weakness of the US Dollar. The greenback continues "selling the fact" of the GDP report on Friday.
The US economy grew at an annualized rate of 3.2%, well above expectations and for a quarter that usually sees slow growth. On the other hand, inflation was quite low. High expectations were the reason for the fall. The dollar moved higher after Thursday's upbeat data and markets took profit in a classic "buy the rumor, sell the fact" response.
The Fed's preferred measure of inflation, the Core PCE Price Index is due today, alongside other figures. The pendulum may swing back in the greenback's favor later on.
In the UK, Brexit talks between the two main parties are not going anywhere fast. PM Theresa May's Conservative Party is set for a substantial loss in the elections to the European Parliament and would like to avoid that. However, if she makes concessions to the opposition Labour Party, she may anger the pro-Brexit faction of her party.
The elections are due on May 26th and the UK will likely participate. The current exit date is October 31st. Any news from the talks, which were reportedly "on the verge of collapse" last week, will be of interest.
Central banks on both sides of the Atlantic will announce their decisions later this week and tension is already rising. The Fed decides on Wednesday, and the Bank of England on Thursday.
GBP/USD Technical Analysis

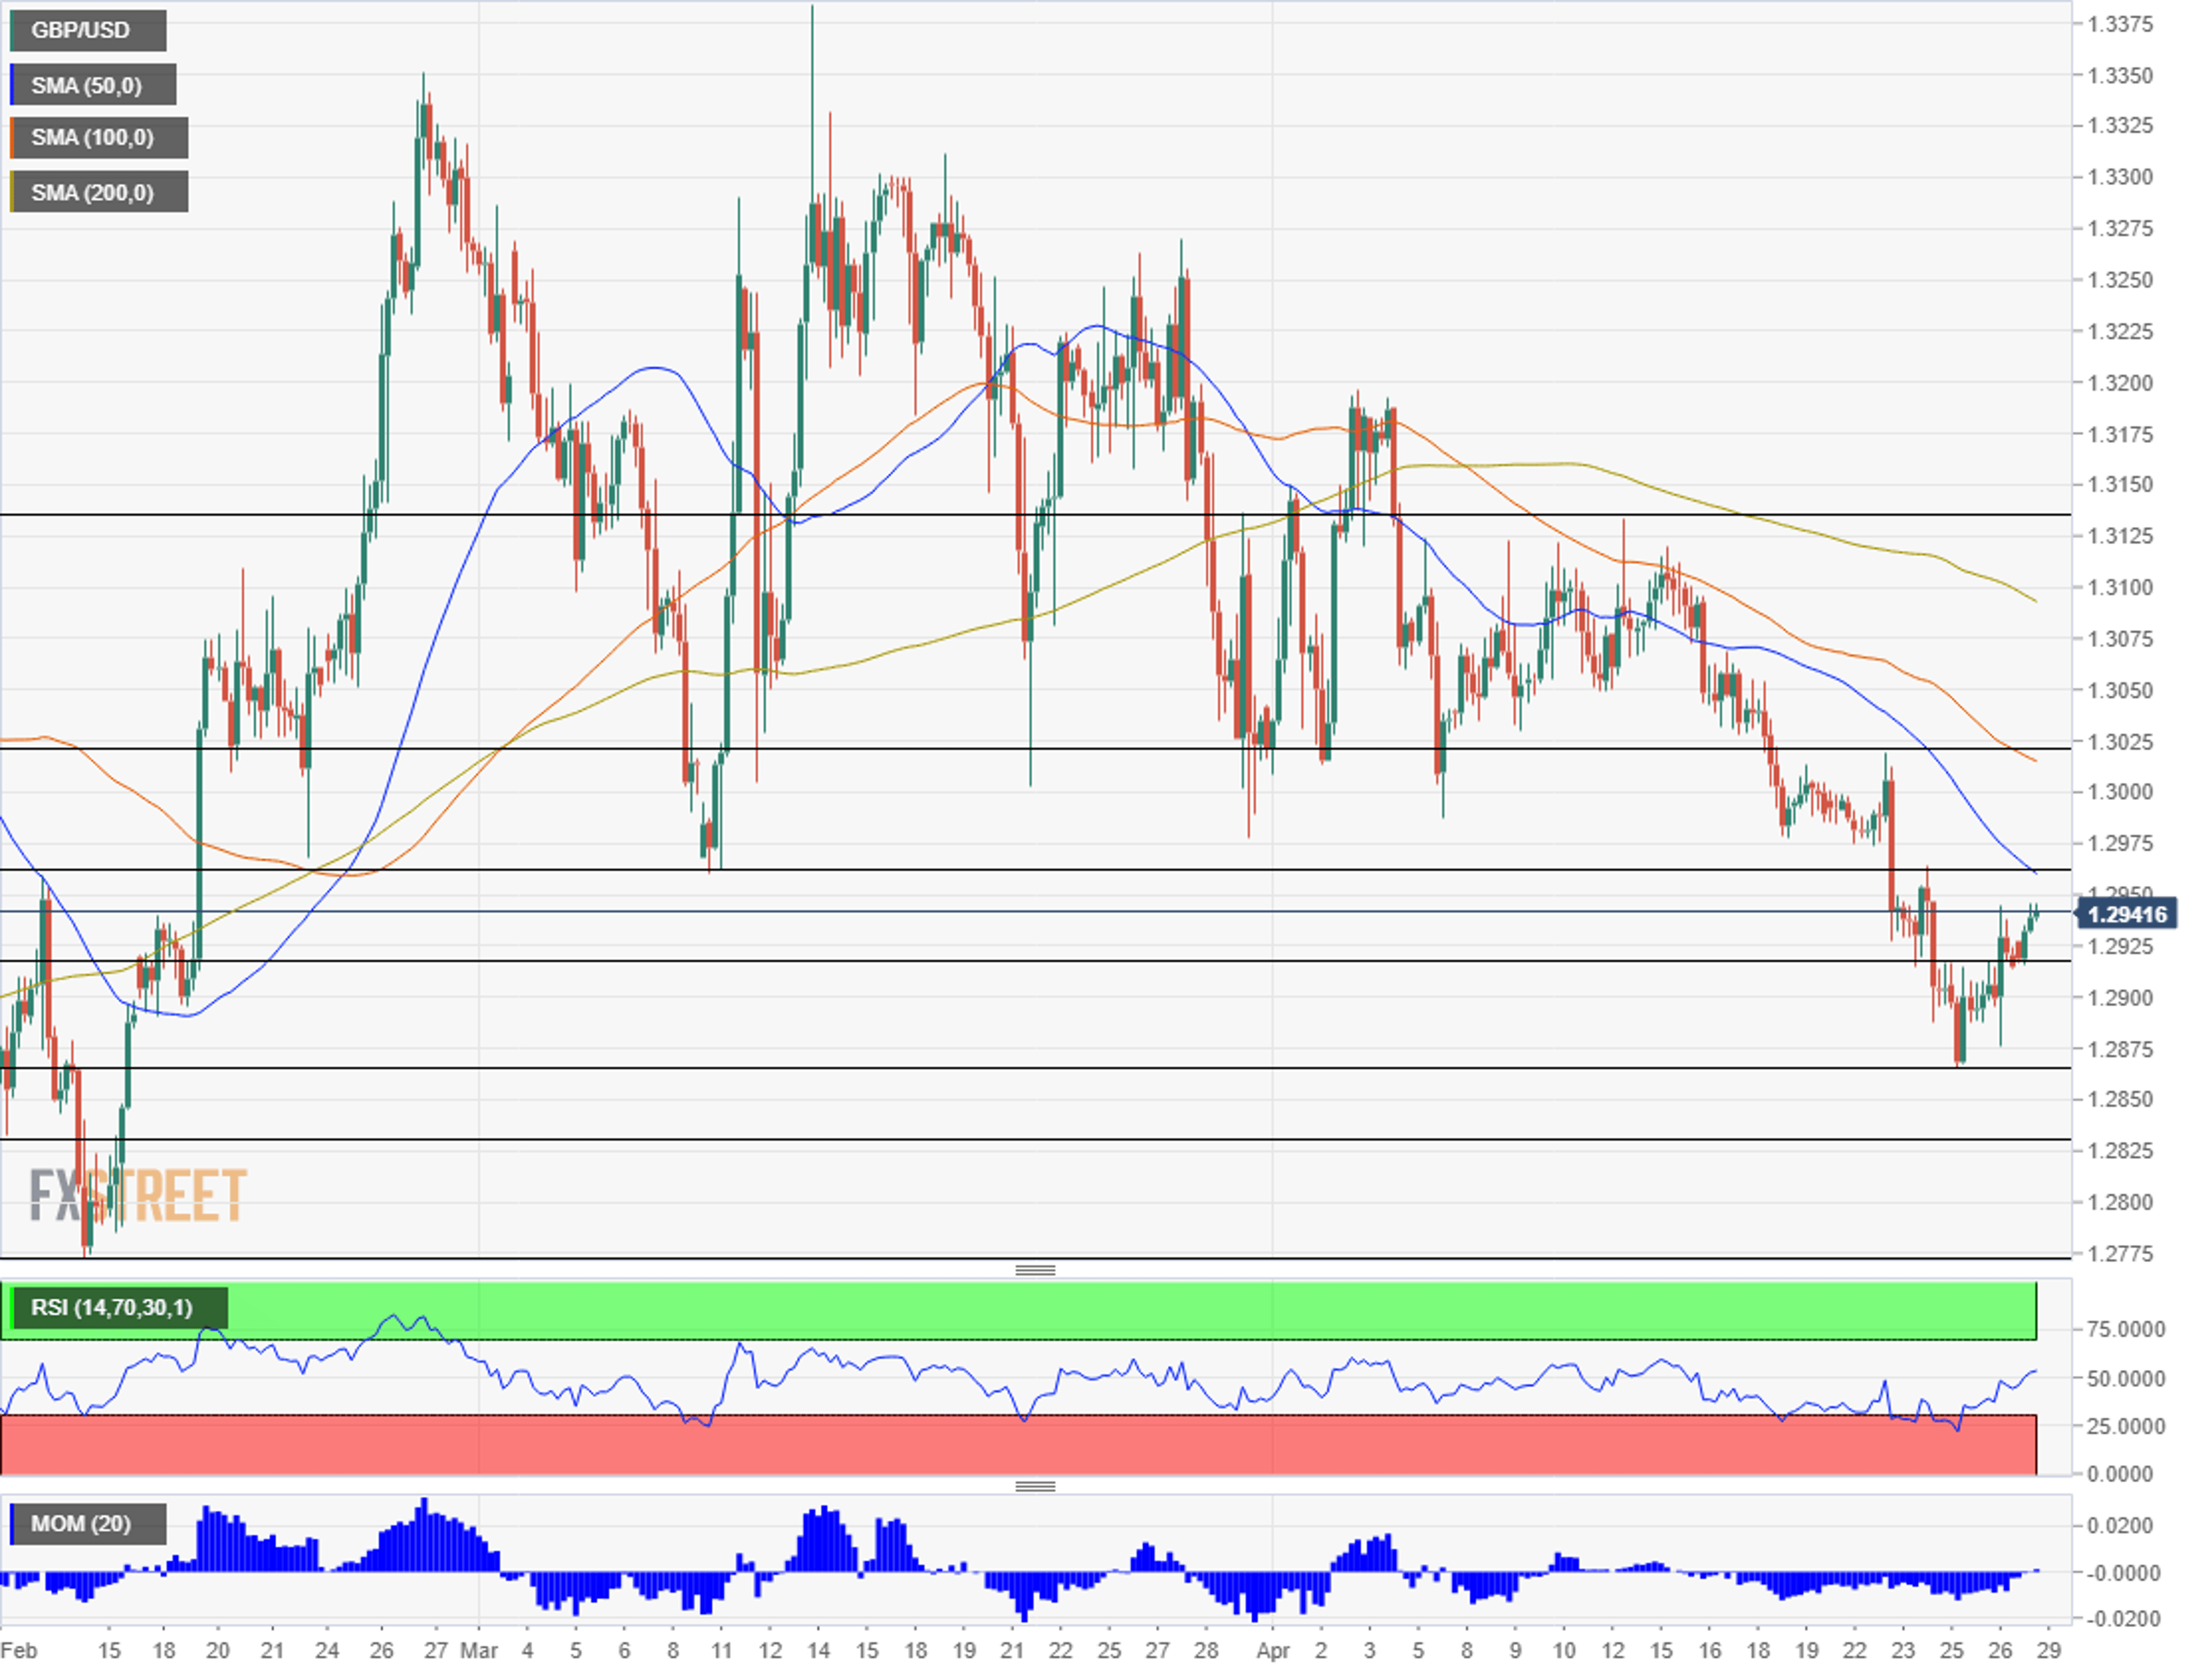
Downside Momentum on the four-hour chart is waning and the Relative Strength Index is on the rise. On the other hand, cable is still below the 50, 100, and 200 Simple Moving Averages.
A substantial test of the upside awaits at 1.2960 which was the lowest point in March and capped a recovery attempt last week. Moreover, it is where the 50 SMA hits the chart at the time of writing.
Further up, 1.3025 was a high point before the recent fall, and 1.3140 capped GBP/USD in mid-April. 1.3200, and 1.3270 are next.
1.2920 held the pair down late last week and serves as the initial support line. 1.2868 is the two-month low, and the next lines are 1.2830 and 1.2775 that were both seen in February.
Image sourced from Pixabay
© 2024 Benzinga.com. Benzinga does not provide investment advice. All rights reserved.
Trade confidently with insights and alerts from analyst ratings, free reports and breaking news that affects the stocks you care about.

