


- The GBP/USD slides lower to trade below 1.3100 with US benchmark Treasury yields rising to April 2011 high of 3.25 precent.
- The confluence of 100-day moving average and 38.2 percent Fibonacci retracement line represents a key resistance area.
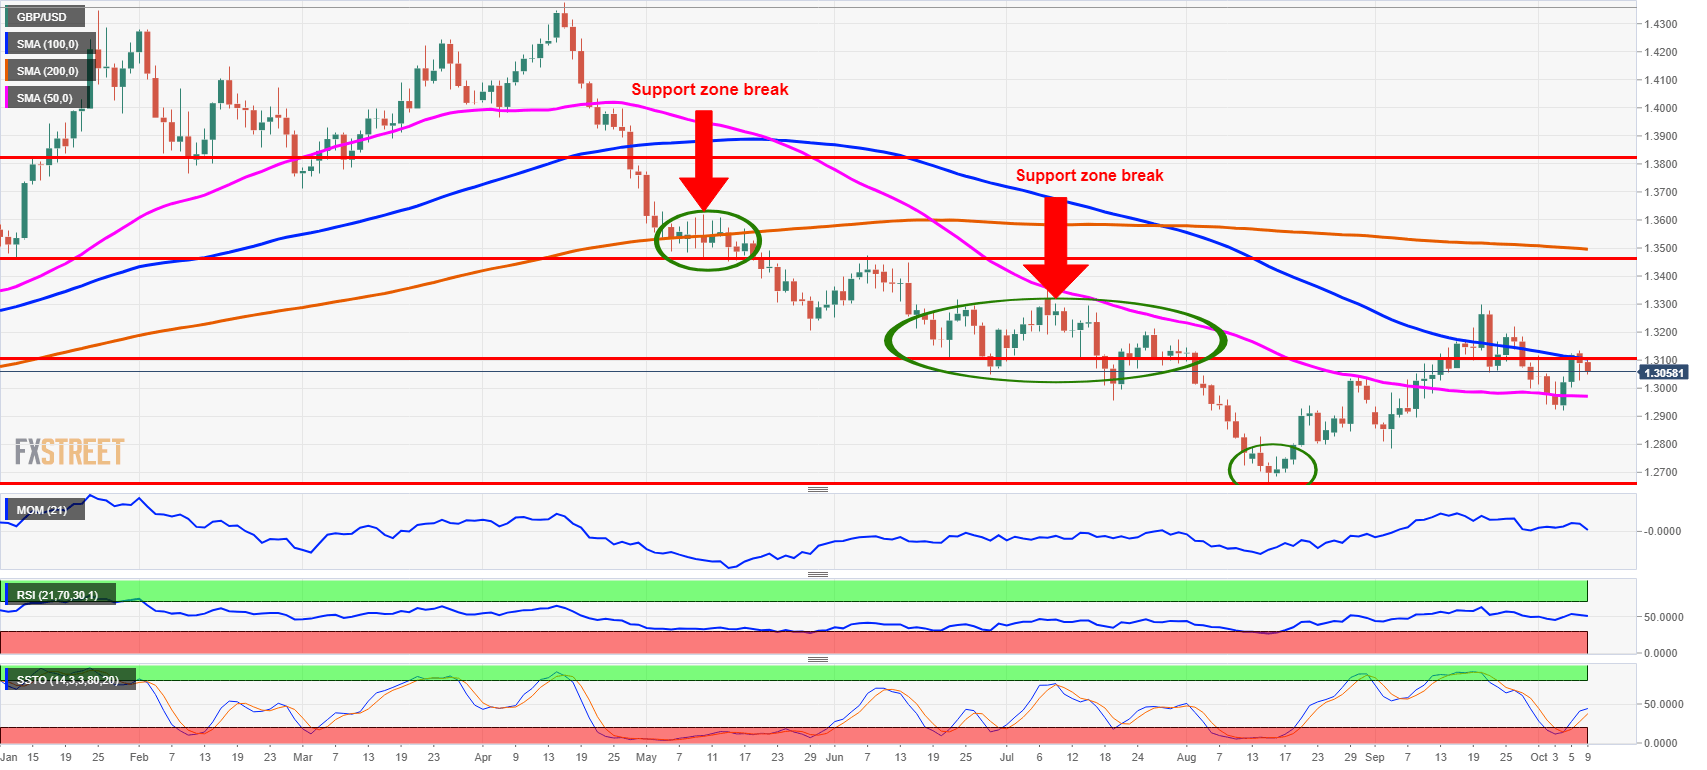
- The GBP/USD is trading within a range of a 50-day and a 100-day moving averages of 1.2972 and 1.3108 respectively.
The GBP/USD is trading down 0.3 percent at around 1.3060 level as the Northern Ireland political leader Arlene Foster travels to Brussels for Brexit discussions with the European Union chief negotiator Michel Barnier.
Foster is a leader of Irish Unionists that supports Theresa May’s government and her meeting is scheduled for the final, so-called “make it or break it” phase of the Brexit negotiations. Apart from Michel Barnier, Arlene Foster is set to meet also representatives of EU member states in next three days. The UK Brexit Secretary canceled his trip to Brussels on Monday concentrating on Brexit proposal at home. The UK cabinet and parliament meet on Tuesday likely discussing the UK budget. The European Union officials are scheduled to meet on Wednesday ahead of the summit next week, October 17.
Earlier on Tuesday, the International Monetary Fund (IMF) published its World Economic Outlook with lower global growth predictions as trade tariffs and the emerging markets' jitters are taking its toll on the growth outlook. Compared to April edition of the World Economic Outlook, the IMF lowered the growth forecast for the UK by -0.2 to 1.4 percent for 2018 while leaving the outlook for 2019 unchanged at 1.5 percent.
The US benchmark Treasury yields rose to 3.25 percent on Tuesday reflecting a recent wave of the positive macroeconomic outlook for the US voiced by numerous Fed officials indicating that the rate hiking cycle is not nearing the end.
Technically, the GBP/USD is trapped within a 50-day and a 100-day moving averages of 1.2971 and 1.3104 respectively. While technical oscillators including Momentum and the Relative Strength Index pointing lower within neutral territory, Slow Stochastics made a bullish crossover in the Oversold territory. Sterling benefitted from lower than expected headline non-farm payroll figure last Friday, jumping up to 1.3135 level, but it was unable to withhold above 1.3104 level representing the confluence of a 100-day moving average and 38.2 percent Fibonacci retracement line. The GBP/USD is now trapped once again within a 50-day moving average of 1.2972 and a 100-day moving average of 1.3108.
GBP/USD daily chart
© 2024 Benzinga.com. Benzinga does not provide investment advice. All rights reserved.
Trade confidently with insights and alerts from analyst ratings, free reports and breaking news that affects the stocks you care about.

