


Rising interest rates are not the only potential headwinds for equities. We were on guard for trade wars the last couple of months due to continual strength in the Chinese Yuan (and US dollar weakness overall). But President Trump decided to get things going with tariffs in an attempt to level the playing field. The threat of trade wars added to market uncertainty last week and we can look for the rhetoric to continue this week as the Trump tariff announcement drew angry responses from global leaders

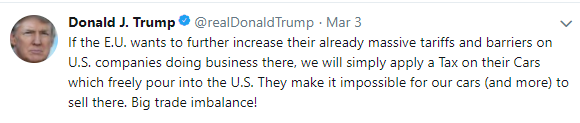
On Saturday President Trump kept up pressure on trading partners by threatening European automakers with a tax on imports if the EU retaliates against his plan to slap tariffs on aluminum and steel. (Reuters)
China said it does not want a trade war with the United States but will defend its interests, according to comments by a Chinese parliament spokesman on Sunday. China’s annual session of parliament begins this week so be ready for more headlines.
Equity indices tapped out on Tuesday ahead of the new Fed Chairman’s first semiannual monetary policy statement. Jerome Powell said, “the FOMC will continue to strike a balance between avoiding an overheated economy and bringing PCE price inflation to 2 percent on a sustained basis."
The word overheated seems to be what hit stocks that day.
ESH is negative short term as it holds below the vwap of the February low and .382. A break of the short term .618 retrace would likely see a third test of its 200dma* Third times are usually not a charm…

The Fed Chairman views market volatility as normal, and not his problem. Powell sees the Fed as having a clear mandate; it’s the economy and not the stock market. If there is a “Powell Put,” it is not on his radar at this time. Fed Governor William Dudley added fuel to the fire when he said that he regarded four rate hikes this year as in line with the "gradual" definition the Fed has been giving to the markets.
Equity markets were soft leading up to the scheduled announcement by the White House on Thursday morning regarding trade policy/tariffs. Equities rallied when the morning announcement was cancelled, but President Trump was just waiting for Fed Chairman Powell to finish his testimony with the Senate. Once his testimony concluded, the White House made the announcement and the selling resumed.
For months the President was obsessed with gains in the stock market. Last week, the White House said that the President is not concerned with the market’s reaction to the tariffs. The administration and the Fed are willing to let the market do what it will and it appears investors now have to watch their own backs.
Bonds and equity indices are in a bit of a predicament. The recent weakness in the indices has given a short term risk off move into fixed income. As bonds rally, it brings buyers back into equities as the threat of rising rates subsides. As long as the long end doesn’t see sharp and sudden move higher in rates, stocks are likely to find buyers on dips.
All eyes will be on Friday’s US employment report. If this confirms the latest data showing wage inflation picking up, market fears of higher interest rates will intensify.
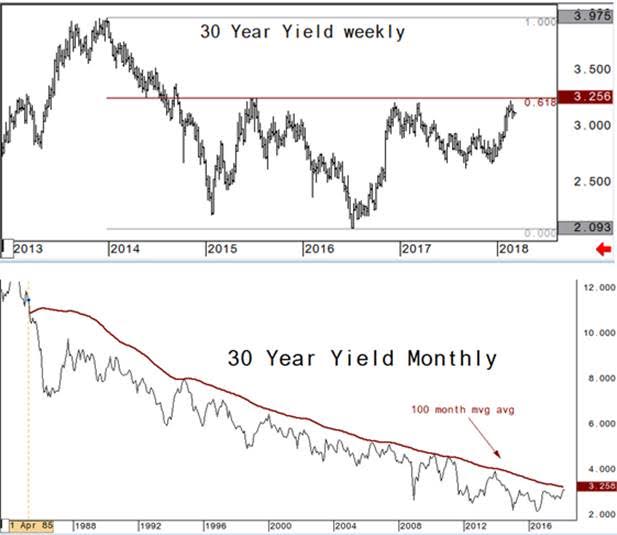
The 3 percent level in the 10 year yield has everyone’s attention, but the longer end may be more important from a technical standpoint. 3.25 percent in the 30 year yield is a key .618 Fibonacci retracement and also the 100 month moving average which has been key resistance at pivotal times in recent years. 30 year yield has not been above the 100 month moving average since April 1985.
Fixed income outperformed equities last week, but iShares Barclays 20+ Yr Treas.Bond TLT vs SPDR S&P 500 ETF Trust SPY remains negative overall with settles below the closing trend line resistance.

The passive investment strategy portrayed by long 30 year future (USH8) and long E-Mini SP 500 (ESH8) broke the yearlong trend channel on February 2nd. Holding the .618* retracement was a key indicator for an equity bounce (and fixed income to stabilize). But, holding below the channel is keeping an overall negative tone.

According to FactSet, ETFs saw record inflows in 2017 at $476.1 billion and the pace is picking up. Last month over $68B was added which was the largest monthly increase in ETF history (read their article here). With retail and institutional accounts utilizing ETFs for portfolio building and altering let’s take a look at some potential key sector plays in the market.
Money flows into the technology sector has pushed Technology Select Sector SPDR Fund XLK to new all-time highs last week, and relative to the S&P 500 XLK/SPY is testing the .382 retracement from the bubble top. We may see a pause around this level and we certainly will need to keep an eye on this leading sector for any potential rhetoric that may cause tech sector weakness. For now, XLK is outperforming PowerShares QQQ Trust, Series 1 QQQ
since the February lows and XLK/QQQ gained above a descending trend line last week.

Small caps outperformed Thursday and Friday, which is likely a good sign for the overall market. iShares Russell 2000 Index IWM/SPY continues to hold the pivotal Fibonacci retracement support and 2016 US election lows in the pair. Some form of rotation between sectors will be considered a positive event for the market as it was during all of 2017.


Potential rotation may find its way into the energy sector this week as the CERAWeek energy conference starts today. OPEC officials are expected to hold a dinner with US shale firms today and officials from US, Canada and Mexico on the panel for Wednesday. Energy Select Sector SPDR XLE has been underperforming crude oil again as the energy sector was a crowded trade at the beginning of the year. The unwind in energy has XLE down -7.3 percent on the year while the front month crude oil future is +2.5 percent.

Crude Oil futures have been outperforming the E-Mini S&P since June and that helped pull the energy names with it going into 2018. And, WTI continues to outperform ES. But, as you can see, XLE has greatly underperformed SPY since mid-January as XLE/SPY breaks the 2017 lows. As this trade has become less crowded we should look for some mean reversion for either crude oil weakness or rotation into XLE and energy sector names. Our gut says the latter.

Weekly chart of XLE vs XLF: rotation out of energy has also gone into financials. XLE relative to Financial Select Sector SPDR Fund XLF is currently testing a long term key and potential support at the 2005 significant top which was also the breakout area in June 2007 (financial crisis).

The European indices have been underperforming and the DAX is down -12 percent from the year high, nearly hit the August significant low last week. A break of this level would likely set up for another leg lower.

The US$ remains weak, especially USDJPY. We don’t see much support here until 103.20 area.

The metals are clearly a dollar play at this time. We like to use .786 Fibonacci retracement for potential reversals and in GLD relative to SPY this retracement held nicely as key support last week. With continued dollar weakness GLD will start to outperform from here.

In conclusion: trade wars, interest rates, currency wars, and high sector correlations are all potential headwinds for equities. And, with the Fed willing to let market forces determine risk asset prices we can look for continued volatility, uncertainty and pullbacks that equate to more than just a dip. Be nimble.
David Wienke is the editor of Keystone Charts. More than 30 years of experience providing technical analysis and execution services to institutional clients is now provided in a daily newsletter, The Daily Game Plan. Coverage includes equities, rates, currencies, and commodities. Dave is also an introducing broker with Capital Trading Group, LLLP (CTG); a Chicago based investment firm focusing on alternative investment opportunities for CTAs and individual investors. Charts are created using CQG, a fantastic trading and charting service. For a free trial of the Daily Game Plan newsletter go to www.keystonecharts.net , email me at dave@keystonecharts.net or go to Capital Trading Group to subscribe.
© 2024 Benzinga.com. Benzinga does not provide investment advice. All rights reserved.
Trade confidently with insights and alerts from analyst ratings, free reports and breaking news that affects the stocks you care about.

