


What FiveThirtyEight found is that, between 1972 and 1992, the distribution of state margins became narrower. However, in the two decades that followed, the trend reverted.
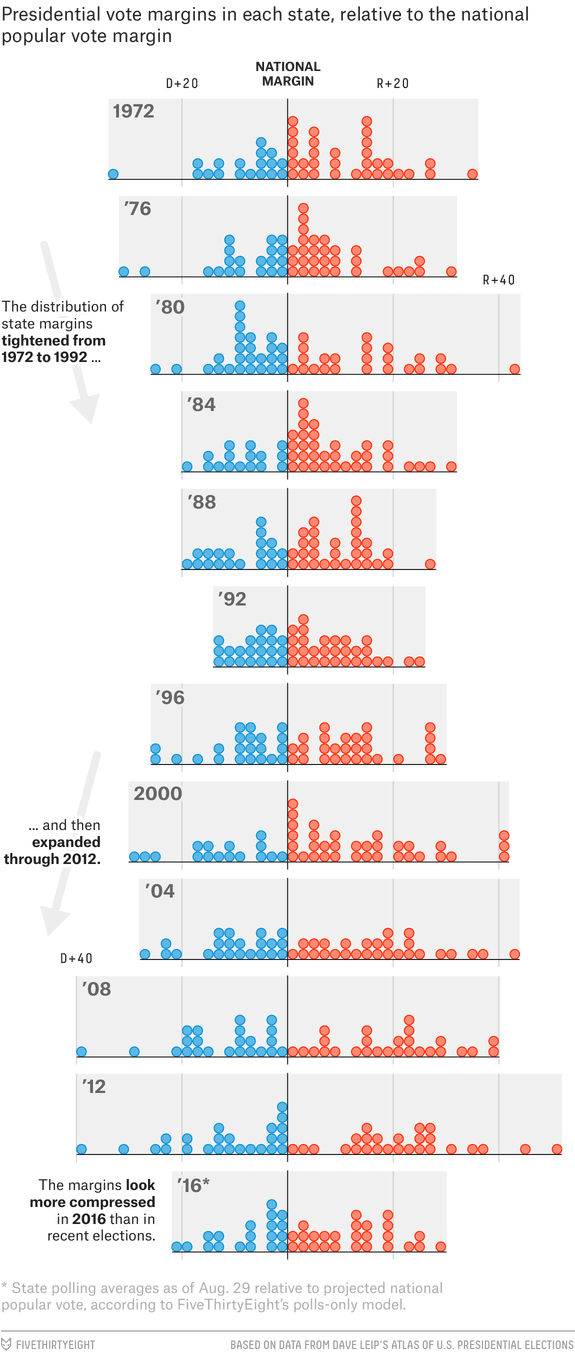
In 1992, Bill Clinton’s spread stood around 37 points, with Massachusetts and Utah representing the pro and anti-Clinton extremes, respectively. In 2012, the spread was much larger: 91 points. In this election, the “bluest” state was Hawaii, and the “reddest” state, once again Utah.
What this shows is how much more polarized American politics have become over the '90s and 2000s, with the number of swing states getting smaller.
Back To The '80s
The 2016 presidential run looks quite different than the ones seen in the past couple of decades and more like a late '80s election. While the popular vote has not been cast yet, estimates point toward a more concentrated distribution of electoral margins — although very red Wyoming and very blue Hawaii haven’t been factored in yet.
“This year, in addition to having less of a spread, has more states with closer absolute margins than other recent elections,” King pointed out. “In 2008, for example, only six states had electoral margins of 5 percentage points or less; this year, our polling averages show 11 states as being that close.”
So, what’s different? Simply put, it’s Trump.
While the controversial candidate has been performing strongly in polls in some traditionally Democratic states, he has been alienating people in some Republican states, pushing them into the “toss-up zone.”
Having said this, it should be noted that the electoral map isn’t changing that much this year, the author concluded. “If you take state results from 2012 in the chart above and adjust them for how the country has shifted as a whole at this point in the cycle, you’ll have a pretty accurate picture of where each state stands currently.”
Do you have ideas for articles/interviews you'd like to see more of on Benzinga? Please email feedback@benzinga.com with your best article ideas. One person will be randomly selected to win a $20 Amazon gift card!
Disclosure: Javier Hasse holds no interest in any of the securities or entities mentioned above.
© 2024 Benzinga.com. Benzinga does not provide investment advice. All rights reserved.
Trade confidently with insights and alerts from analyst ratings, free reports and breaking news that affects the stocks you care about.

