


8 Hourly Chart

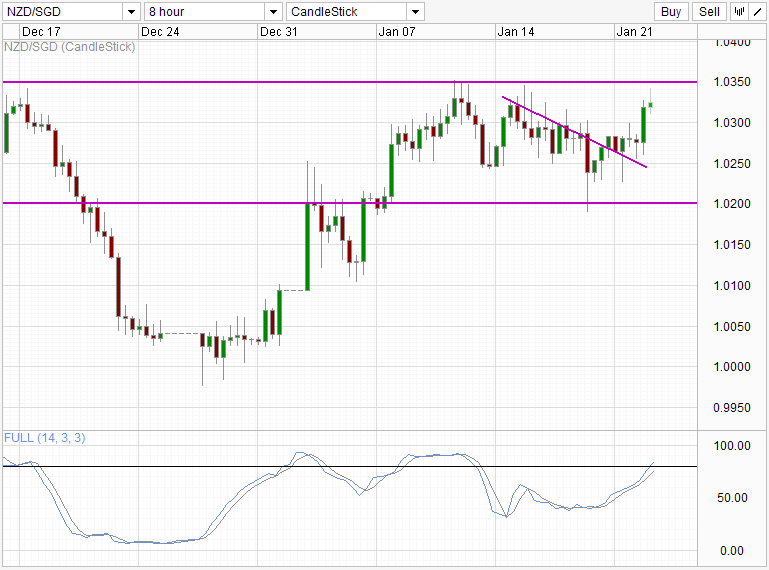
NZD/SGD has broke away from the downward trendline to trade higher at the start of the trading week. Price looks on track to reach 1.035, which was the ceiling for price action since Dec '12. With Stochastic readings heading towards Overbought region, it is highly likely we could experience some resistance around 1.035, however that should not be interpreted as a bearish reversal. Support can be found 1st around 1.025, and subsequently 1.02 levels. Also, divergence between price and stochastic levels (comparing 2nd Jan levels vs today) suggest that overall price still have some legs to run before turning around fully.
Weekly Chart
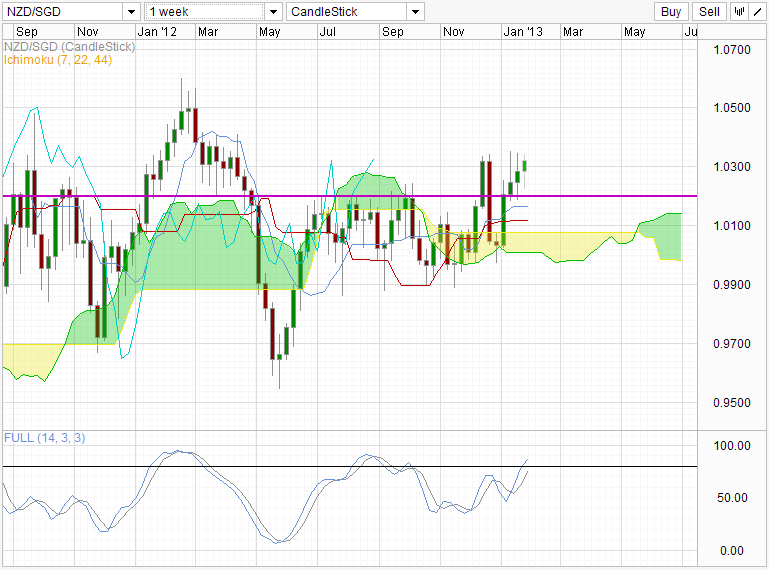
Weekly Chart mostly agree with hourly chart, with current price trading above the Kumo and the bullish Kumo Twist hinting of more gains to come. Also, from the weekly chart, 1.035 resistance is not immediately recognizable, with 1.03 probably a better representation of support/resistance on the Weekly Chart. Trading above 1.03 will give Bulls more confidence of a move towards 1.05. Unfortunately, Stochastic is also hinting of over-extension with readings entering Overbought range, though historically readings has peaked higher beyond 80.0, giving us some more room for rally. Current Kumo below price is also flat, suggesting that the “equilibrium” price could be lower closer to 1.01. Should price fail to break higher, we could expect price to head towards the Kumo from now till early May.
From a fundamental perspective, NZD economy is under scrutiny especially after Australia's employment figures disappoint. Kiwi's own labor wasn't so hot either back in 2012 with unemployment rate hitting a 13 year high. Singapore on the other hand is contending with a declining manufacturing sector amidst a growth slowdown. Exports has also decreased dramatically, bringing doubts to further SGD gains. In essence, NZD/SGD is pitting 2 declining economies against each other, hardly ideal for strong trends to emerge. Traders will need to look out for Central Bank signals beyond economic data for a longer trend to emerge.
Get OANDA's exclusive weekly Market Pulse FX
Email Address:</ strong>This article is for general information purposes only. It is not investment advice or a solution to buy or sell securities. Opinions are the authors; not necessarily that of OANDA Corporation or any of its affiliates, subsidiaries, officers or directors. Leveraged trading is high risk and not suitable for all. You could lose all of your deposited funds.

© 2024 Benzinga.com. Benzinga does not provide investment advice. All rights reserved.
Trade confidently with insights and alerts from analyst ratings, free reports and breaking news that affects the stocks you care about.

