


Daily Chart

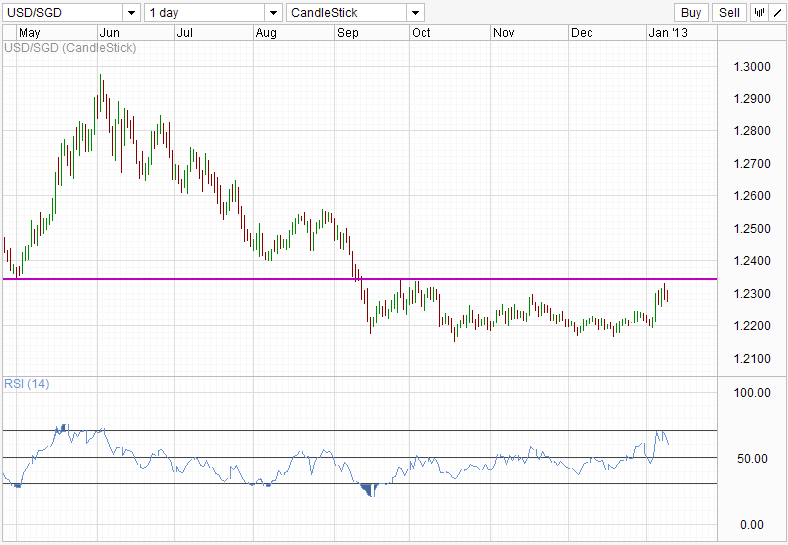
RSI 14 briefly entered Overbought territory 2 days ago, reaching highest reading since Jun '12 and subsequently retreated just as price failed to break Support/Resistance around 1.234.
Daily Chart Zoomed In
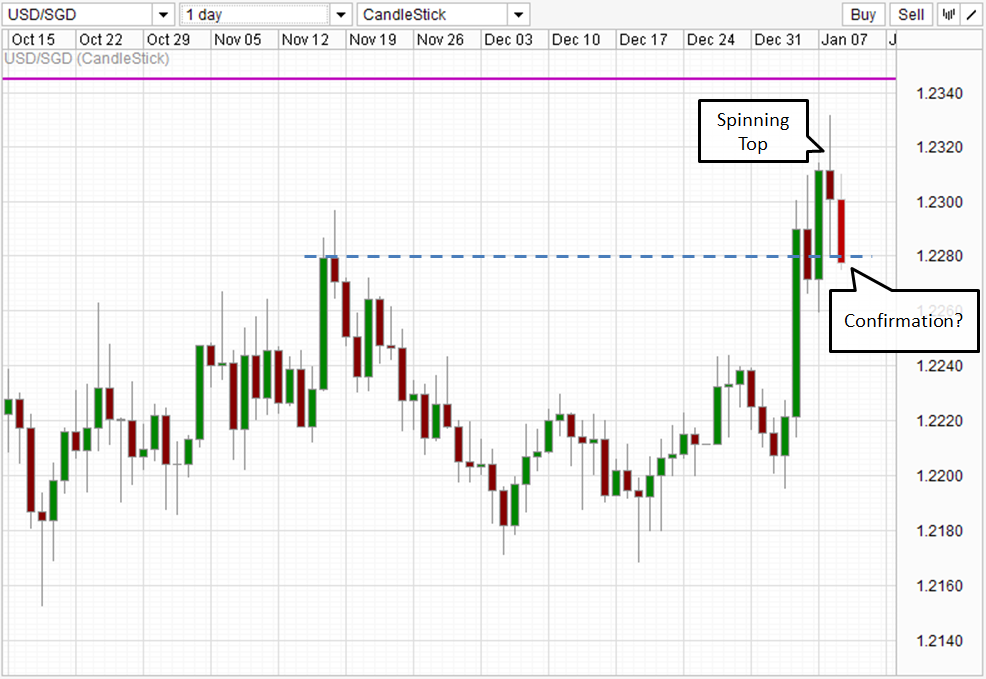
Zooming in, we can see a Black Spinning Top with a subsequent long bearish candle – Not a maribozu, but still reflecting strong bearish intend. However, chartists should be mindful about the reliability of this “confirmation” candlestick, as the full body is just slightly above 20 pips long, a midget compared to all the daily candles you will find on G7 currencies. Nonetheless, if price close below the previous swing high back in Nov '12, and preferably fully below 1.226, the confirmation would be stronger.
30 minutes Chart
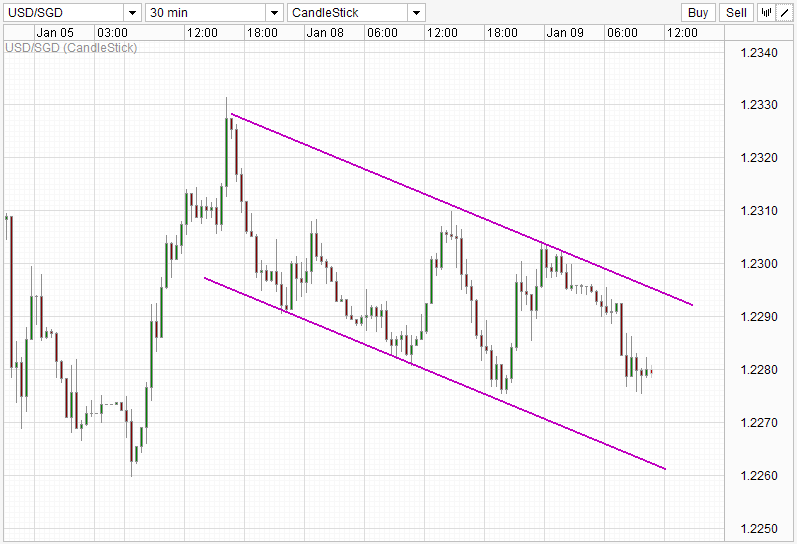
Downward channel has been spotted with a move towards the bottom channel already on the way. Baring any sudden shocks, we could see price descending slowly within the channel. Interim support can still be found around current 1.228 and subsequently 1.226.
This article is for general information purposes only. It is not investment advice or a solution to buy or sell securities. Opinions are the authors; not necessarily that of OANDA Corporation or any of its affiliates, subsidiaries, officers or directors. Leveraged trading is high risk and not suitable for all. You could lose all of your deposited funds.

© 2024 Benzinga.com. Benzinga does not provide investment advice. All rights reserved.
Trade confidently with insights and alerts from analyst ratings, free reports and breaking news that affects the stocks you care about.

