


The S&P 500 rose 28.9% in 2019, outperforming the 10-year average of 11.8%. That performance puts 2019 in unique company—it was the 11th best performance in S&P 500 history dating back to 1928 and the second best in the past 20 years.


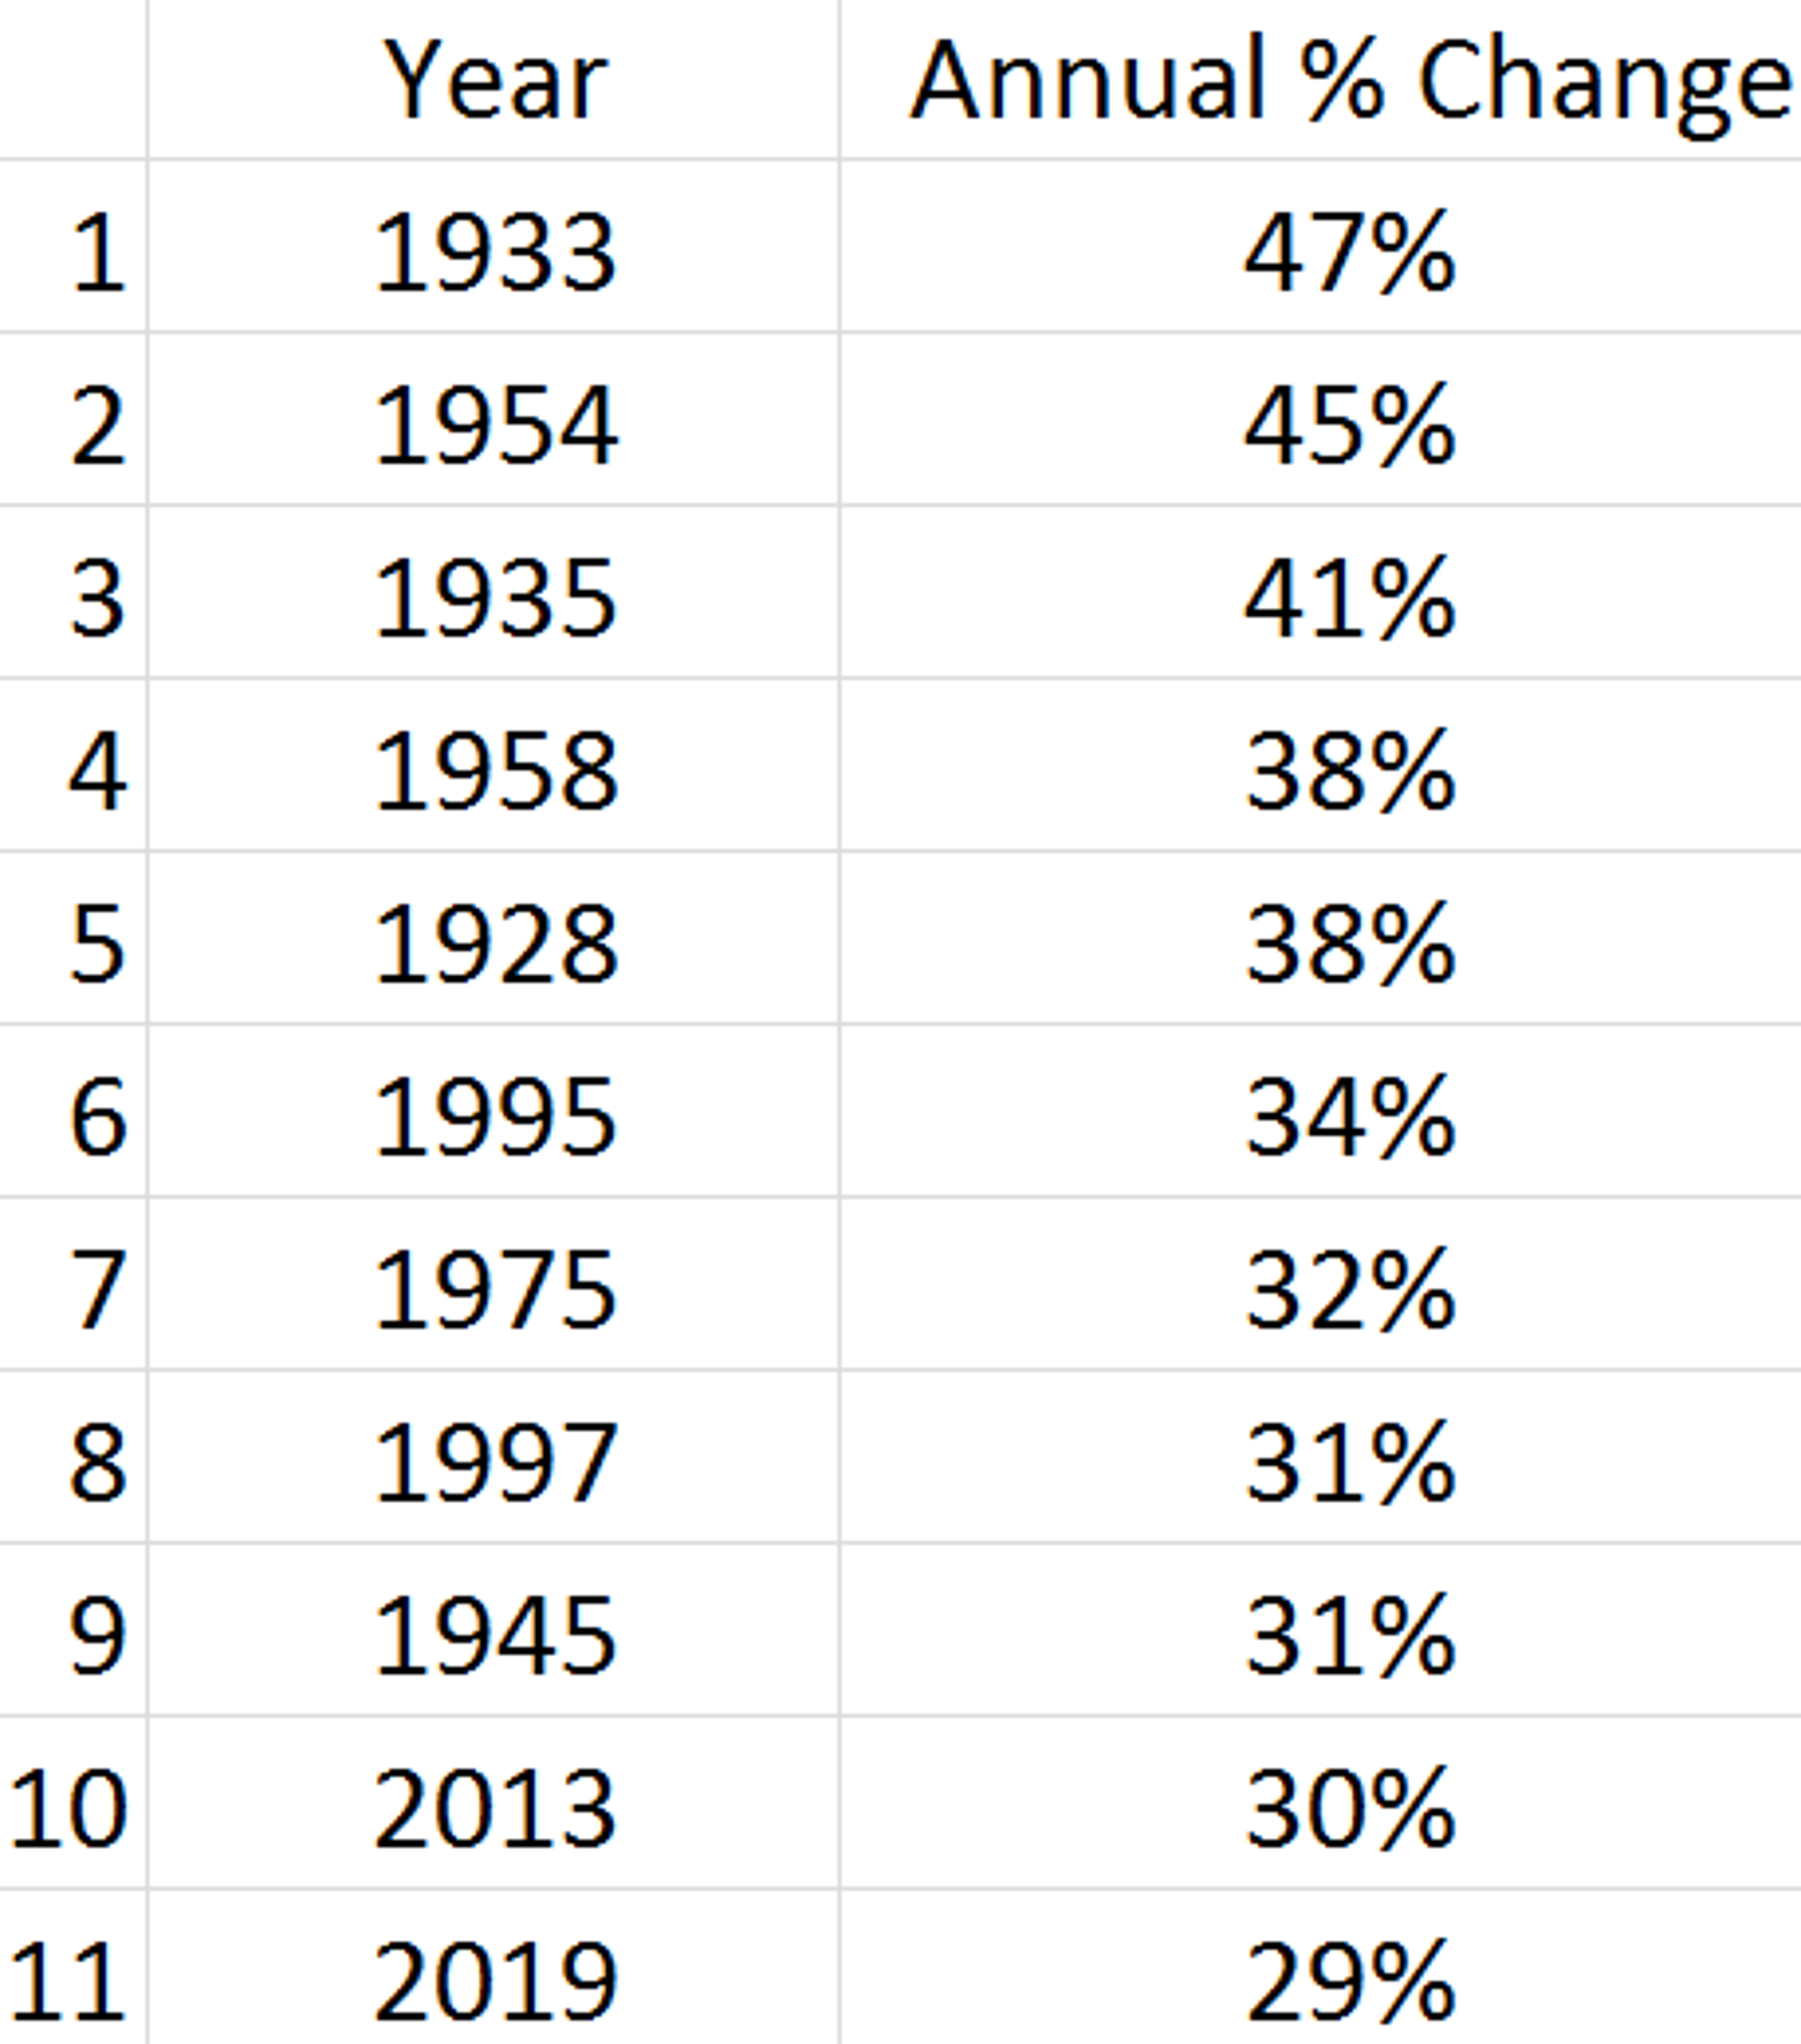
But what does that outperformance mean for the markets in 2020? History has shown us that in the years following the 10-best S&P 500 years, the index more often than not posts a positie gain. A negative return has only happened three times: 1928, 1933, and 1945.


This year is also unique because of the role played by the presidential elections. This leads to the question of how the S&P 500 typically performs during presidential elections.

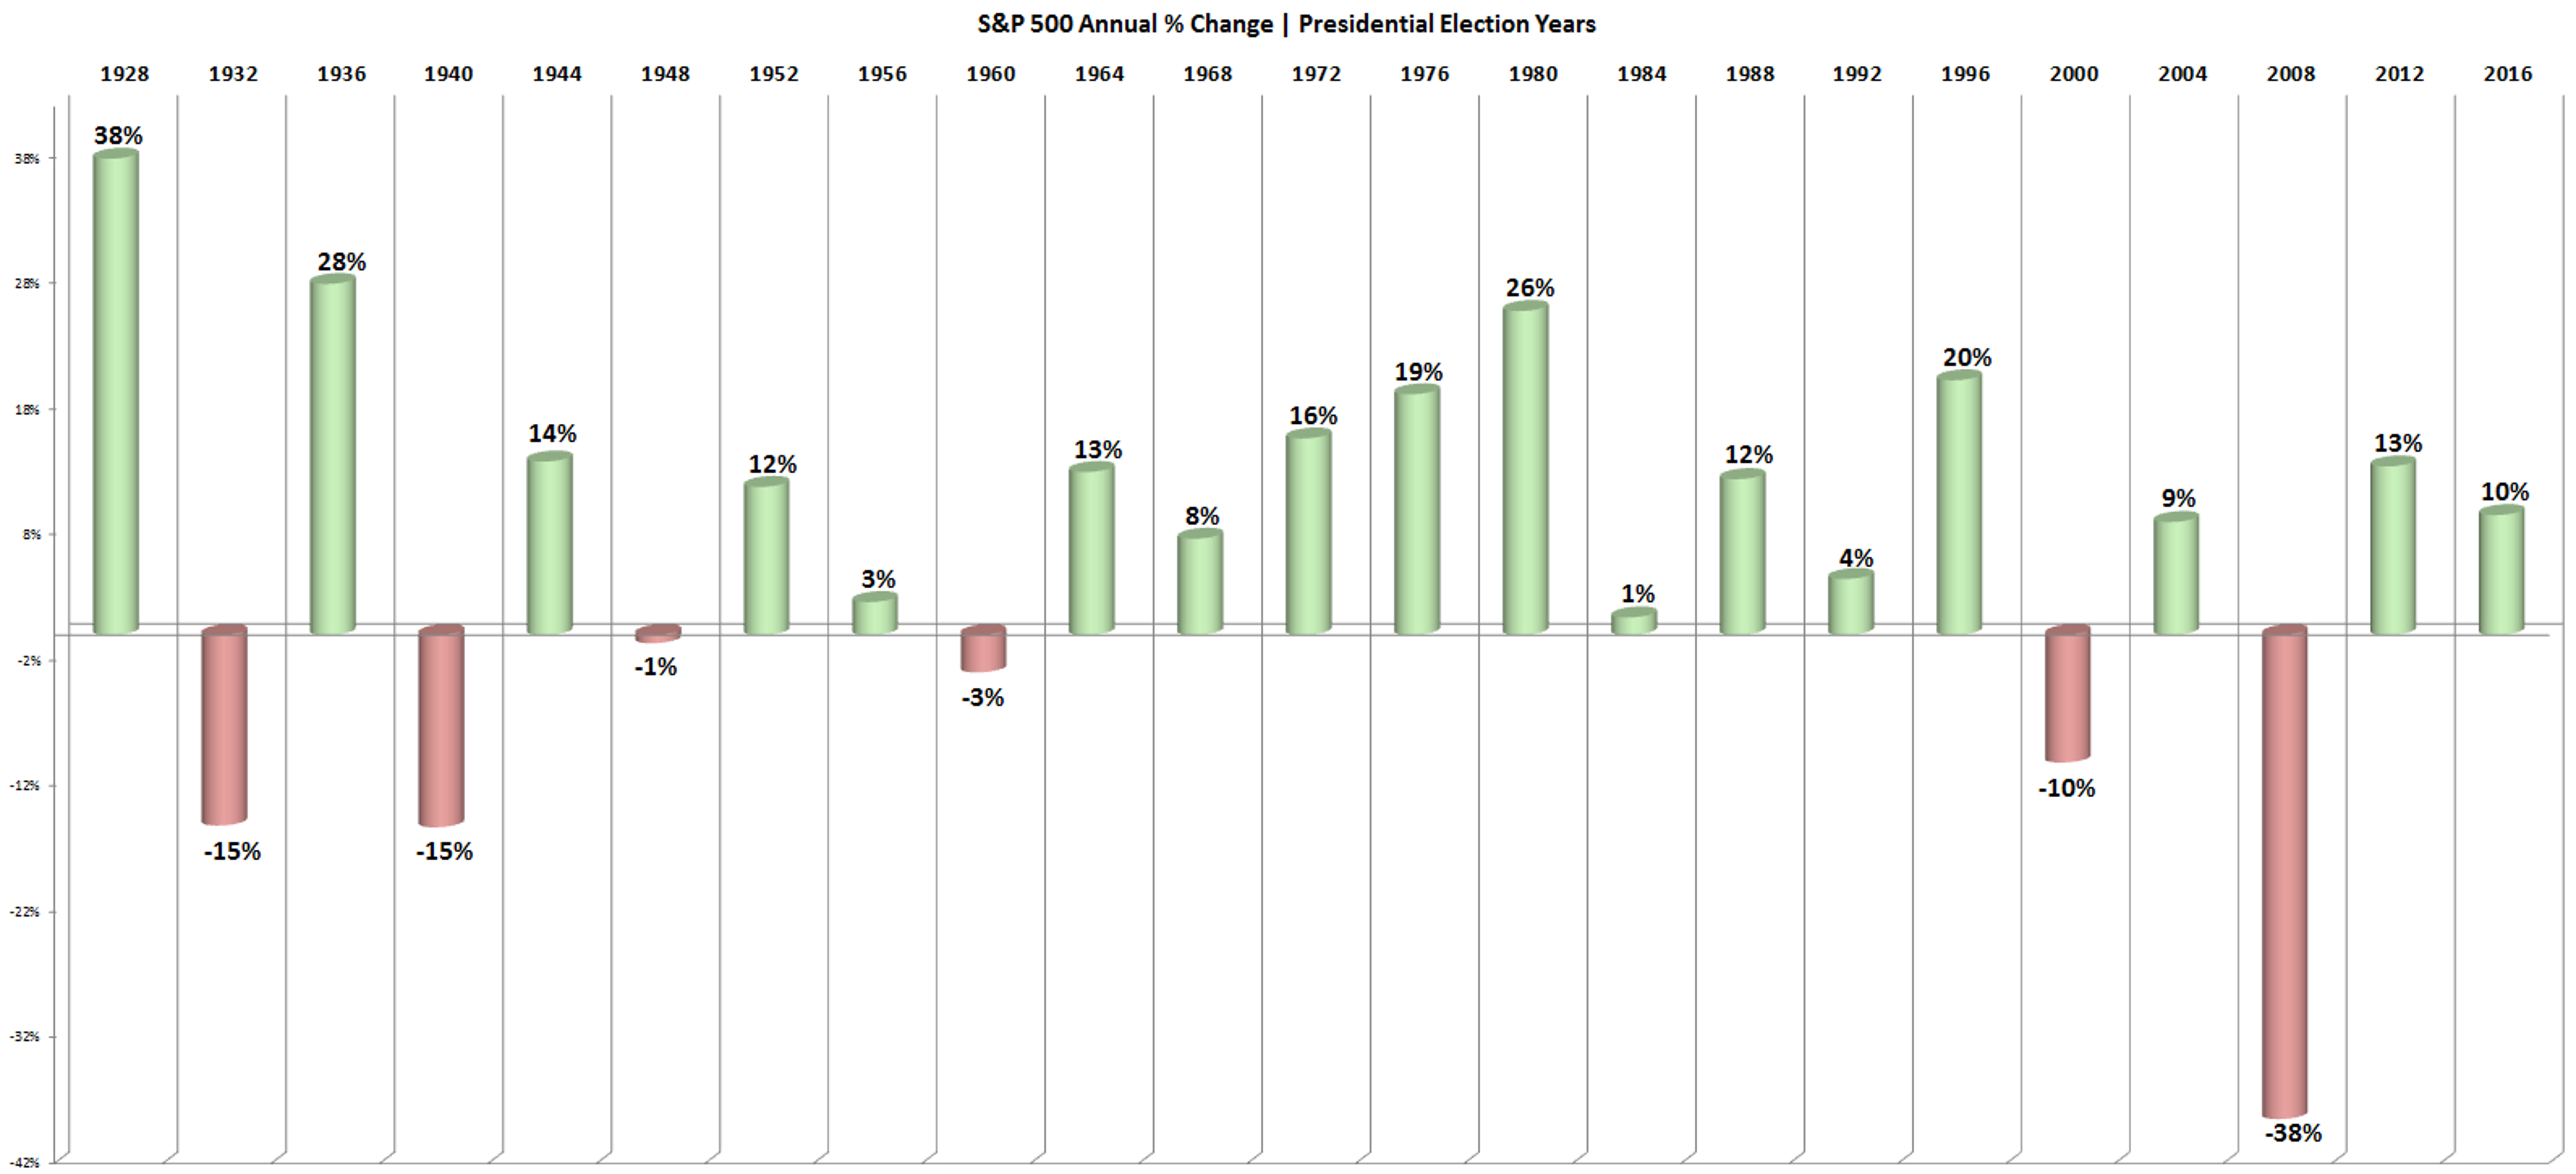
Since 1928, the S&P 500 has shown a negative performance only six times in Presidential election years. More typically, it has closed with strong gains.


In the past 50 years, the S&P 500 has dropped two times during the presidential elections: the dot-com bubble burst in 2000 and the financial crisis in 2008.
Both were unforeseeable events in terms of timing. Based on historical patterns, the S&P 500 should look forward to another year with a strong closing.
Alexander Voigt is the CEO and founder of daytradingz.com
© 2024 Benzinga.com. Benzinga does not provide investment advice. All rights reserved.
Trade confidently with insights and alerts from analyst ratings, free reports and breaking news that affects the stocks you care about.

