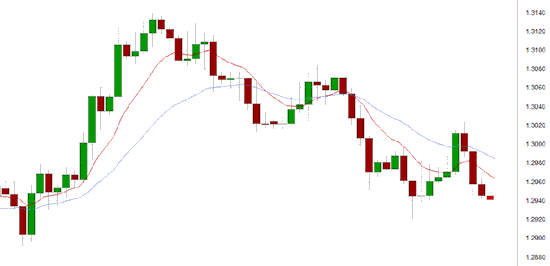
The last couple of weeks has seen the Euro meet significant selling pressure near the resistance level around 1.3160 and move away steadily. Over the last week, it had been receiving solid support at 1.30 although in the last few days, it has dropped below there despite its best efforts to hang on. The recent resistance level around 1.3150 has definitely played a role and placed excess supply pressure on the Euro, and the short term support level at 1.30 hasn't been as steadfast in maintaining price.
In the last few weeks the Euro has rallied well and been able to push back off the support level at 1.28 and up towards 1.30 and then some, however the resistance level near 1.3160 has stood firm and fended off advances. Now that it appears that the Euro has broken through 1.30 and been unable to hang on, the 1.29 is likely to become a factor having shown some support a few weeks ago. The 1.28 level still remains a significant level and the Euro is likely to test this level again should it continue to ease away from 1.30 and move through 1.29. (Daily chart / 4 hourly chart below)
daily chart

4 hourly chart
EUR/USD |
Oct 25 at 23:15 GMT |
| 1.2943/44 | H: 1.3023 | L: 1.2927 |
| S3 | S2 | S1 | R1 | R2 | R3 |
| 1.2900 | 1.2800 | 1.2600 | 1.3000 | 1.3150 | — |
EUR/USD Technical
- During the early hours of the Asian trading session on Friday, the Euro is consolidating around 1.2940 after its heavy falls in the previous 12 hours.
- The recent resistance level around 1.3150 has played a role again over the last week, and more recently, the Euro has struggled to hold on to 1.30.
- The 1.28 level emerged as a key level too having shown solid support for the Euro at its last reversal and is poised to do so again should the Euro continue to drift lower.
- There are now severel levels likely to offer support over the longer term having recently moved through several strong resistance levels. Eg. 1.24, 1.26, and 1.28.
- Current range: Just below 1.2950.
Further levels in both directions:
- Below: 1.2900, 1.2800 and 1.2600.
- Above: 1.3000 and 1.3150.
October 26
- US 12:30 (GMT) Core PCE Price Index (Adv.) (Q3)
- US 12:30 (GMT) GDP Annualised (Adv.) (Q3)
- US 12:30 (GMT) GDP Deflator (Adv.) (Q3)
- US 13:55 (GMT) Univ of Mich Sent. (Final) (Oct)
This article is for general information purposes only. It is not investment advice or a solution to buy or sell securities. Opinions are the authors; not necessarily that of OANDA Corporation or any of its affiliates, subsidiaries, officers or directors. Leveraged trading is high risk and not suitable for all. You could lose all of your deposited funds.
© 2024 Benzinga.com. Benzinga does not provide investment advice. All rights reserved.
Trade confidently with insights and alerts from analyst ratings, free reports and breaking news that affects the stocks you care about.