


- Central banks move quickly looking to oversight all payments.
- Greece could impose sanctions if digital means are not used in at least 30% of payments.
- Once inside the crypto ecosystem, governments have little capacity for financial censorship.
With the upcoming arrival of the new year, the publications of data of the current year, comparatives and projections accumulate.
From everything I've been reading, I have selected three different news items, which perhaps, presenting them all together, will help us see some hints of what next year can bring to the crypto universe.
The first news item speaks of a sharp increase in payments made with Bitcoins in the dark-net. After the end of 2018, in which the volume of payments made using Bitcoin fell more than 10%, the forecast for the end of the current year points to an increase of 30%, reaching $1,000 million.
Earlier this week, news broke that Alex Patelis, the chief economic adviser to the prime minister, is proposing to force the Greek population to spend 30% of their income using electronic payment methods. The measure aims to increase the country's revenues by €700 million a year by preventing tax fraud.
The threads that would sew these two remnants of today are the CBDC or Central Bank Digital Currency. Learn the concept. Yesterday, Christine Lagarde, president of the ECB (European Central Bank), announced the creation of a working committee on the CBDC, intending to advance rapidly towards the launch of this instrument.
China plans to launch its CBDC at the beginning of 2020, Canada is already set to work on it, and every week a new initiative is made public.
What I extract from the three news items is that we are moving towards a society where governments will control the payments that everyone makes. Governments are preparing to implement 100% electronic payment systems, in a quest to eliminate tax evasion.
The CBDC is the specific instrument to impose a financial version of Big Brother will be imposed.
And what do Bitcoin and other cryptocurrencies represent? It seems that the role of cryptocurrencies will be to replace the digital currencies issued by the states in those payments that, for whatever reason, we do not want to.
The use of cryptocurrencies is impossible to avoid. They are decentralized, anonymous and once inside the ecosystem, there is nothing a government can do to set limits.
ETH/BTC Daily Chart
ETH/BTC is currently trading at 0.0199 and ends the week at the same level at which it began.
Above the current price, the first resistance level is at 0.020, then the second at 0.022 and the third one at 0.023.
Below the current price, the first support level is at 0.019, then the second at 0.018 and the third one at 0.017.

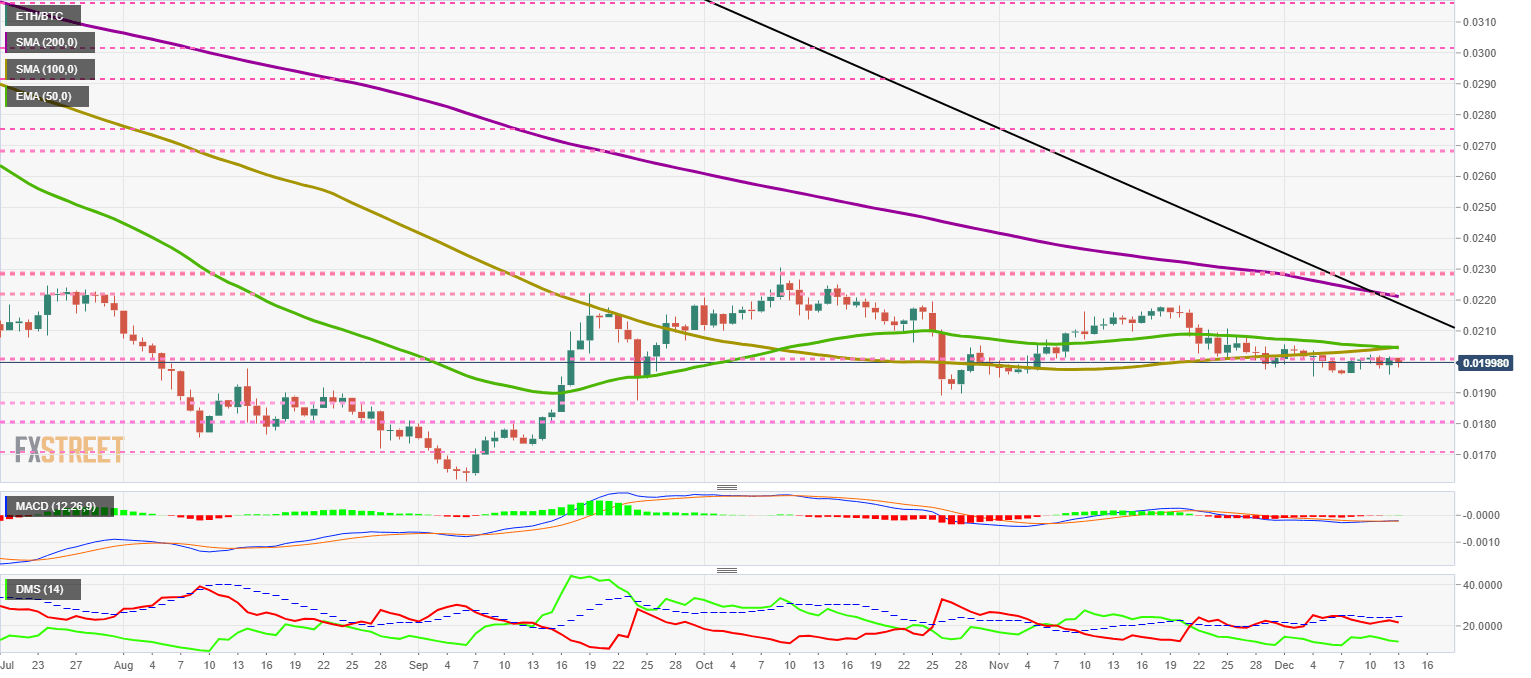
The MACD on the daily chart shows an utterly flat profile with no direction. There is no visibility.
The DMI on the daily chart shows the bears losing strength but still maintaining the advantage against the bulls. The buying side is slightly better than yesterday.
BTC/USD Daily Chart
The BTC/USD pair is currently trading at the $7.210 price level and remains trapped between two parallel bearish structures.
Above the current price, the first resistance level is at $7,500, then the second at $7,900 and the third one at $8,600.
Below the current price, the first support level is at $6,850, then the second at $6,000 and the third one at $5,000.

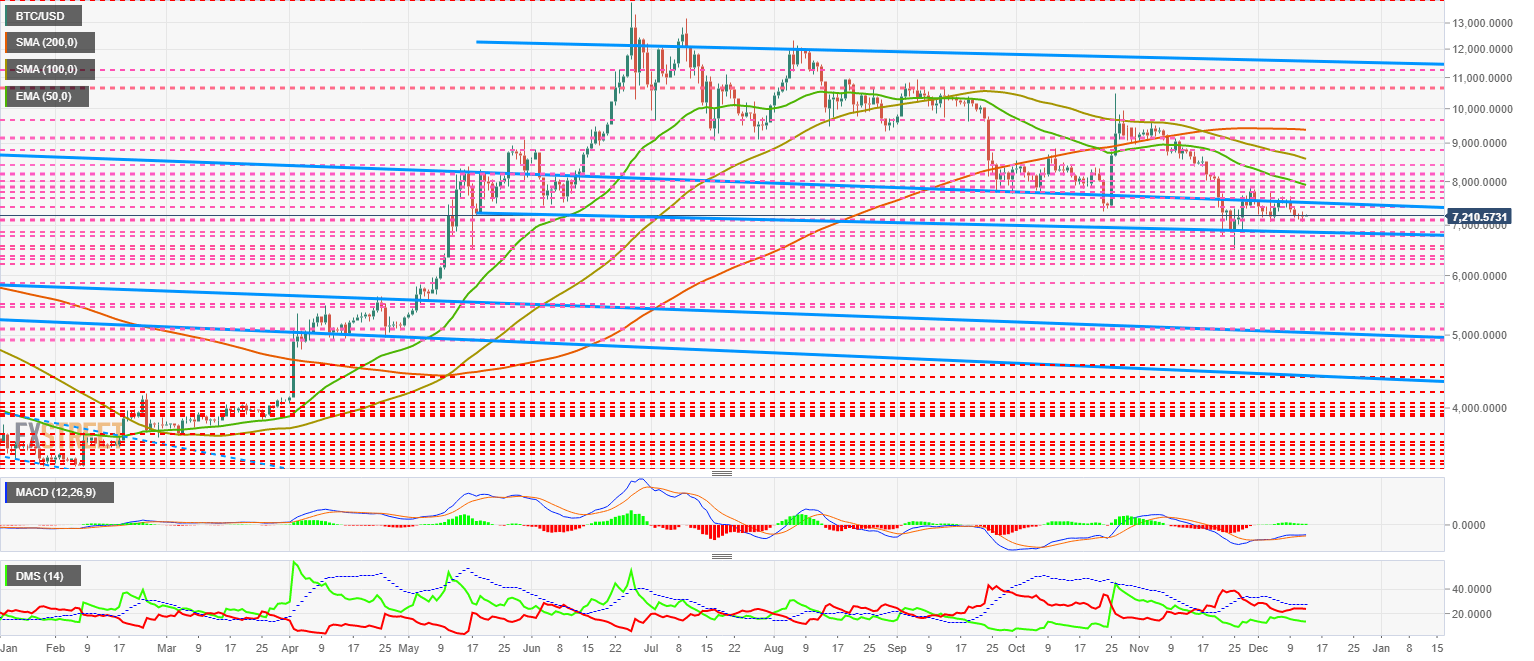
The MACD on the daily chart remains the bullish profile but with hardly any opening between the lines. The loss of bullish strength is absolute.
The DMI on the daily chart shows bears losing strength and moving very close to bull levels. Next week appears to be a crucial week.
ETH/USD Daily Chart
ETH/USD is currently trading at the $144.25 price level, unable to keep above the $150 psychological level. Below the current price, the look would get much worse.
Above the current price, the first resistance level is at $150, then the second at $160 and the third one at $175.
Below the current price, the first support level is at $140, then the second at $130 and the third one at $120.
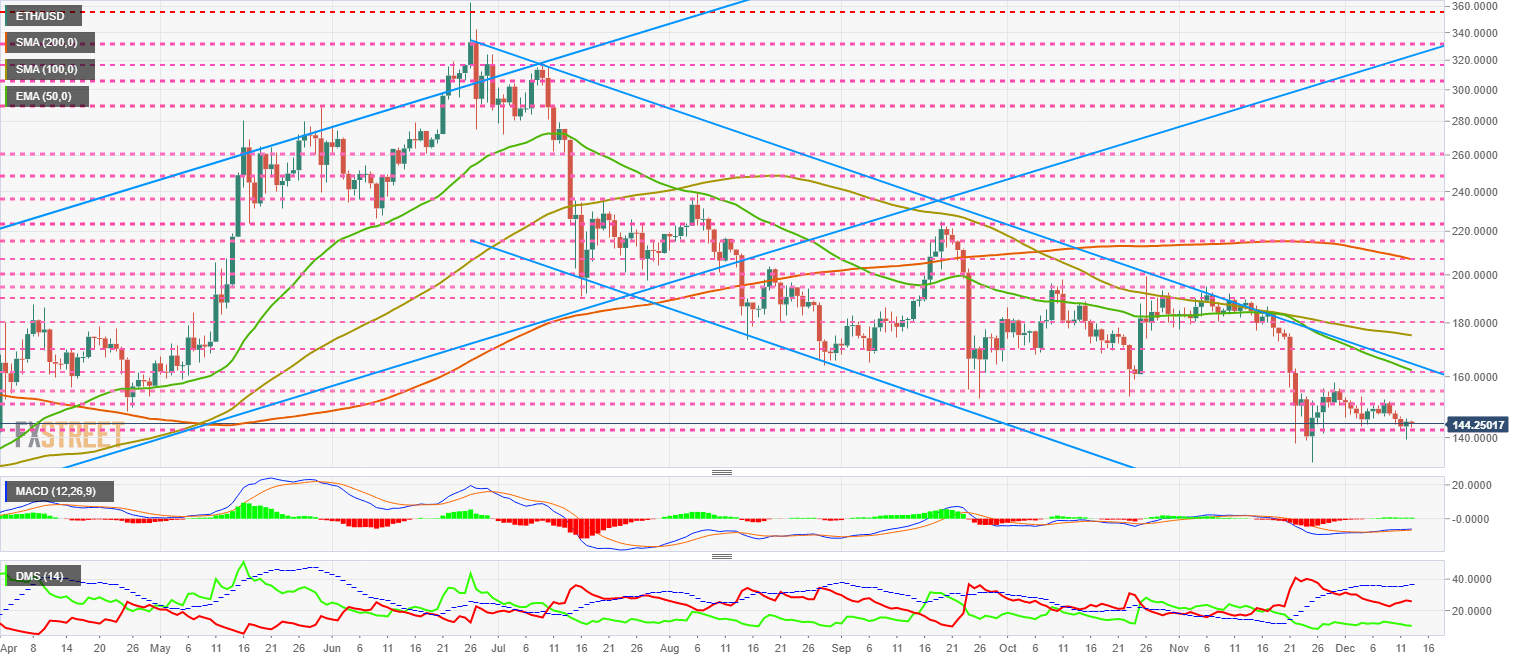
The MACD on the daily chart shows a slightly bullish profile and no openings between the lines. The loss of bullish strength is total.
The DMI on the daily chart shows the bears gaining strength while the bulls lose it slightly.
XRP/USD Daily Chart
XRP/USD is currently trading at the $0.2174 price level and is holding above the critical support low of $0.21.
Above the current price, the first resistance level is at $0.245, then the second at $0.262 and the third one at $0.305.
Below the current price, the first support level is at $0.21, then the second at $0.19 and the third one at $0.1750.

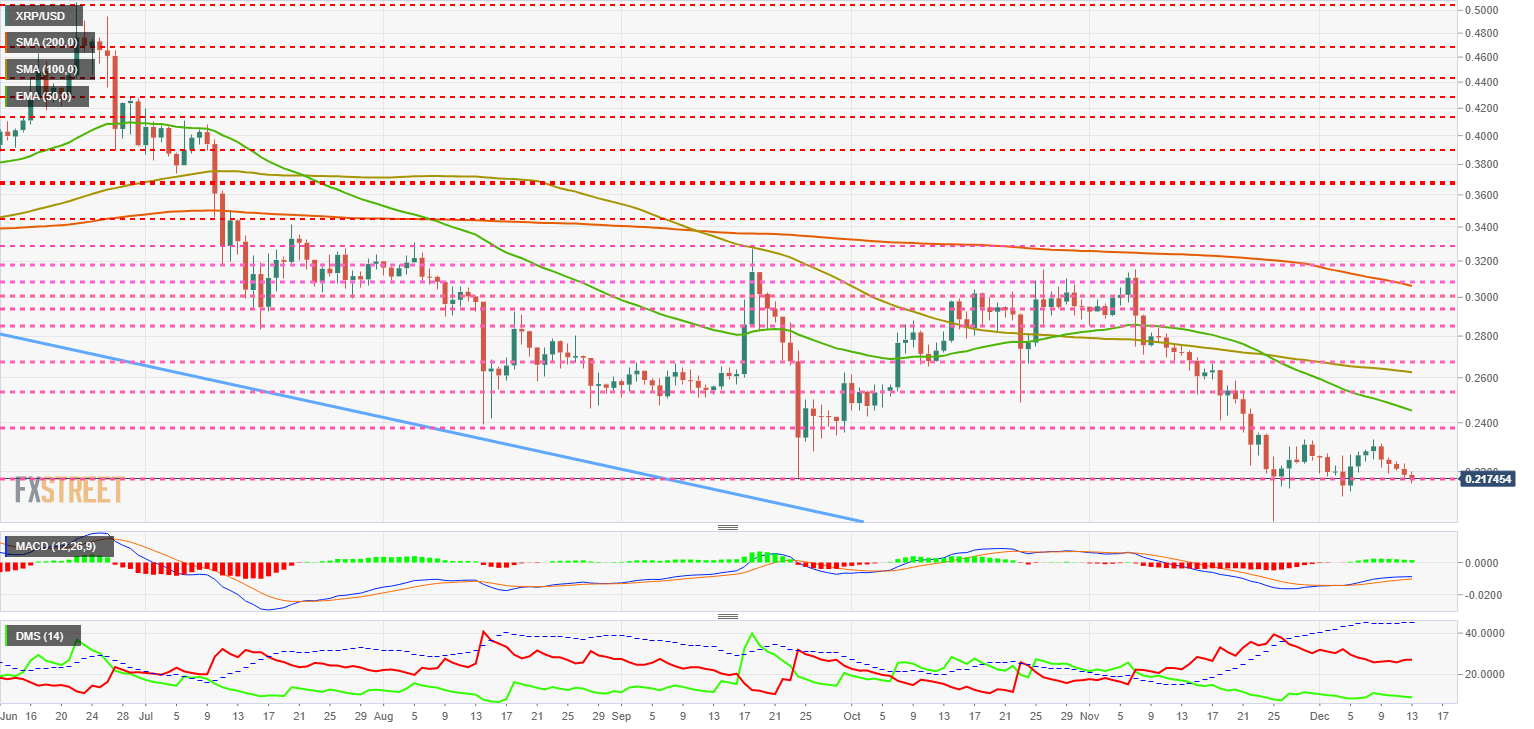
The MACD on the daily chart continues to cross upward and with a bit of openness between the lines. Despite the sideways movement, the XRP/USD pair retains some upside potential.
The DMI on the daily chart shows the bears further increasing their advantage over the bulls. The buyers’ side continues at extreme lows.
Image Sourced from Pixabay
© 2024 Benzinga.com. Benzinga does not provide investment advice. All rights reserved.
Trade confidently with insights and alerts from analyst ratings, free reports and breaking news that affects the stocks you care about.

