


- The BTC/USD blows up its foundations and shows extreme weakness.
- The ETH/USD is in a weak zone and could move toward $100.
- The XRP/USD comes out almost unscathed and retains its rocket ticket to the moon.
It's a bleak image I see on the charts today. The main scenarios have been broken, at least for Bitcoin and Ethereum. Only an upward reaction as furious as the one experienced yesterday on the downward slope could fix things minimally.
Ripple's case is different. It hasn't left the previous scenario despite moving to the lower part of the great base channel in which it has been ranging since May.
The reasons for the decline, according to all sources is the uncertainty caused by the hard pitchfork in Bitcoin Cash that comes into effect today.
I personally don't see how the whole market, in general, can be influenced by an event related to one specific asset.
But trust works that way and what is clear is that many protection stops jumped.
A few days ago I explained that the typical behavior pattern for markets in a very narrow price range is precisely the one we saw yesterday. A violent movement that shakes the weak hands, opens the indicators and allows the engines to start again.
The worst that could happen now would be to return to a narrow price range at these price levels again. It would indicate that the loss of confidence is deep and would probably result in a new sell-off in the near future.
Today's analysis focuses on the daily chart, as I consider that time range to be the optimal one for assessing structural situations.
Do you want to know more about my technical setup?
BTC/USD 1 Day.
The BTC/USD is currently trading at the $5558 price level, a level last seen in November 2017.
The BTC/USD situation is not good at all after yesterday's decline. In the weekly range, it lost the Simple Moving Average of 100 periods and ending the week below it would only leave the SMA200 at $3,000!
The big problem for the BTC/USD is that it has lost the support zone and is now moving into a price area that lacks the right density to get reliable support.
That's why everything suggests that if there is no fresh money to remedy it in the short term, a fall will continue up to the $4,500 zone and this will be inevitable.
Below the current price, the first support is in the minimum of the day at $5473 (congestion support price). The second support is at yesterday's lows of $5.312. This level is marked by a bearish channel projection. This channel is right now the last hope for the BTC/USD to avoid an even bigger debacle.
If the BTC/USD loses this second level of support it would go directly to the third support at $5000 (price congestion support).
Above the current price, the first resistance at the $5,860 price level (price congestion resistance). The second level of resistance is at the base of the channel at $6,000. If achieved, Bitcoin bulls will receive a much-needed encouragement.

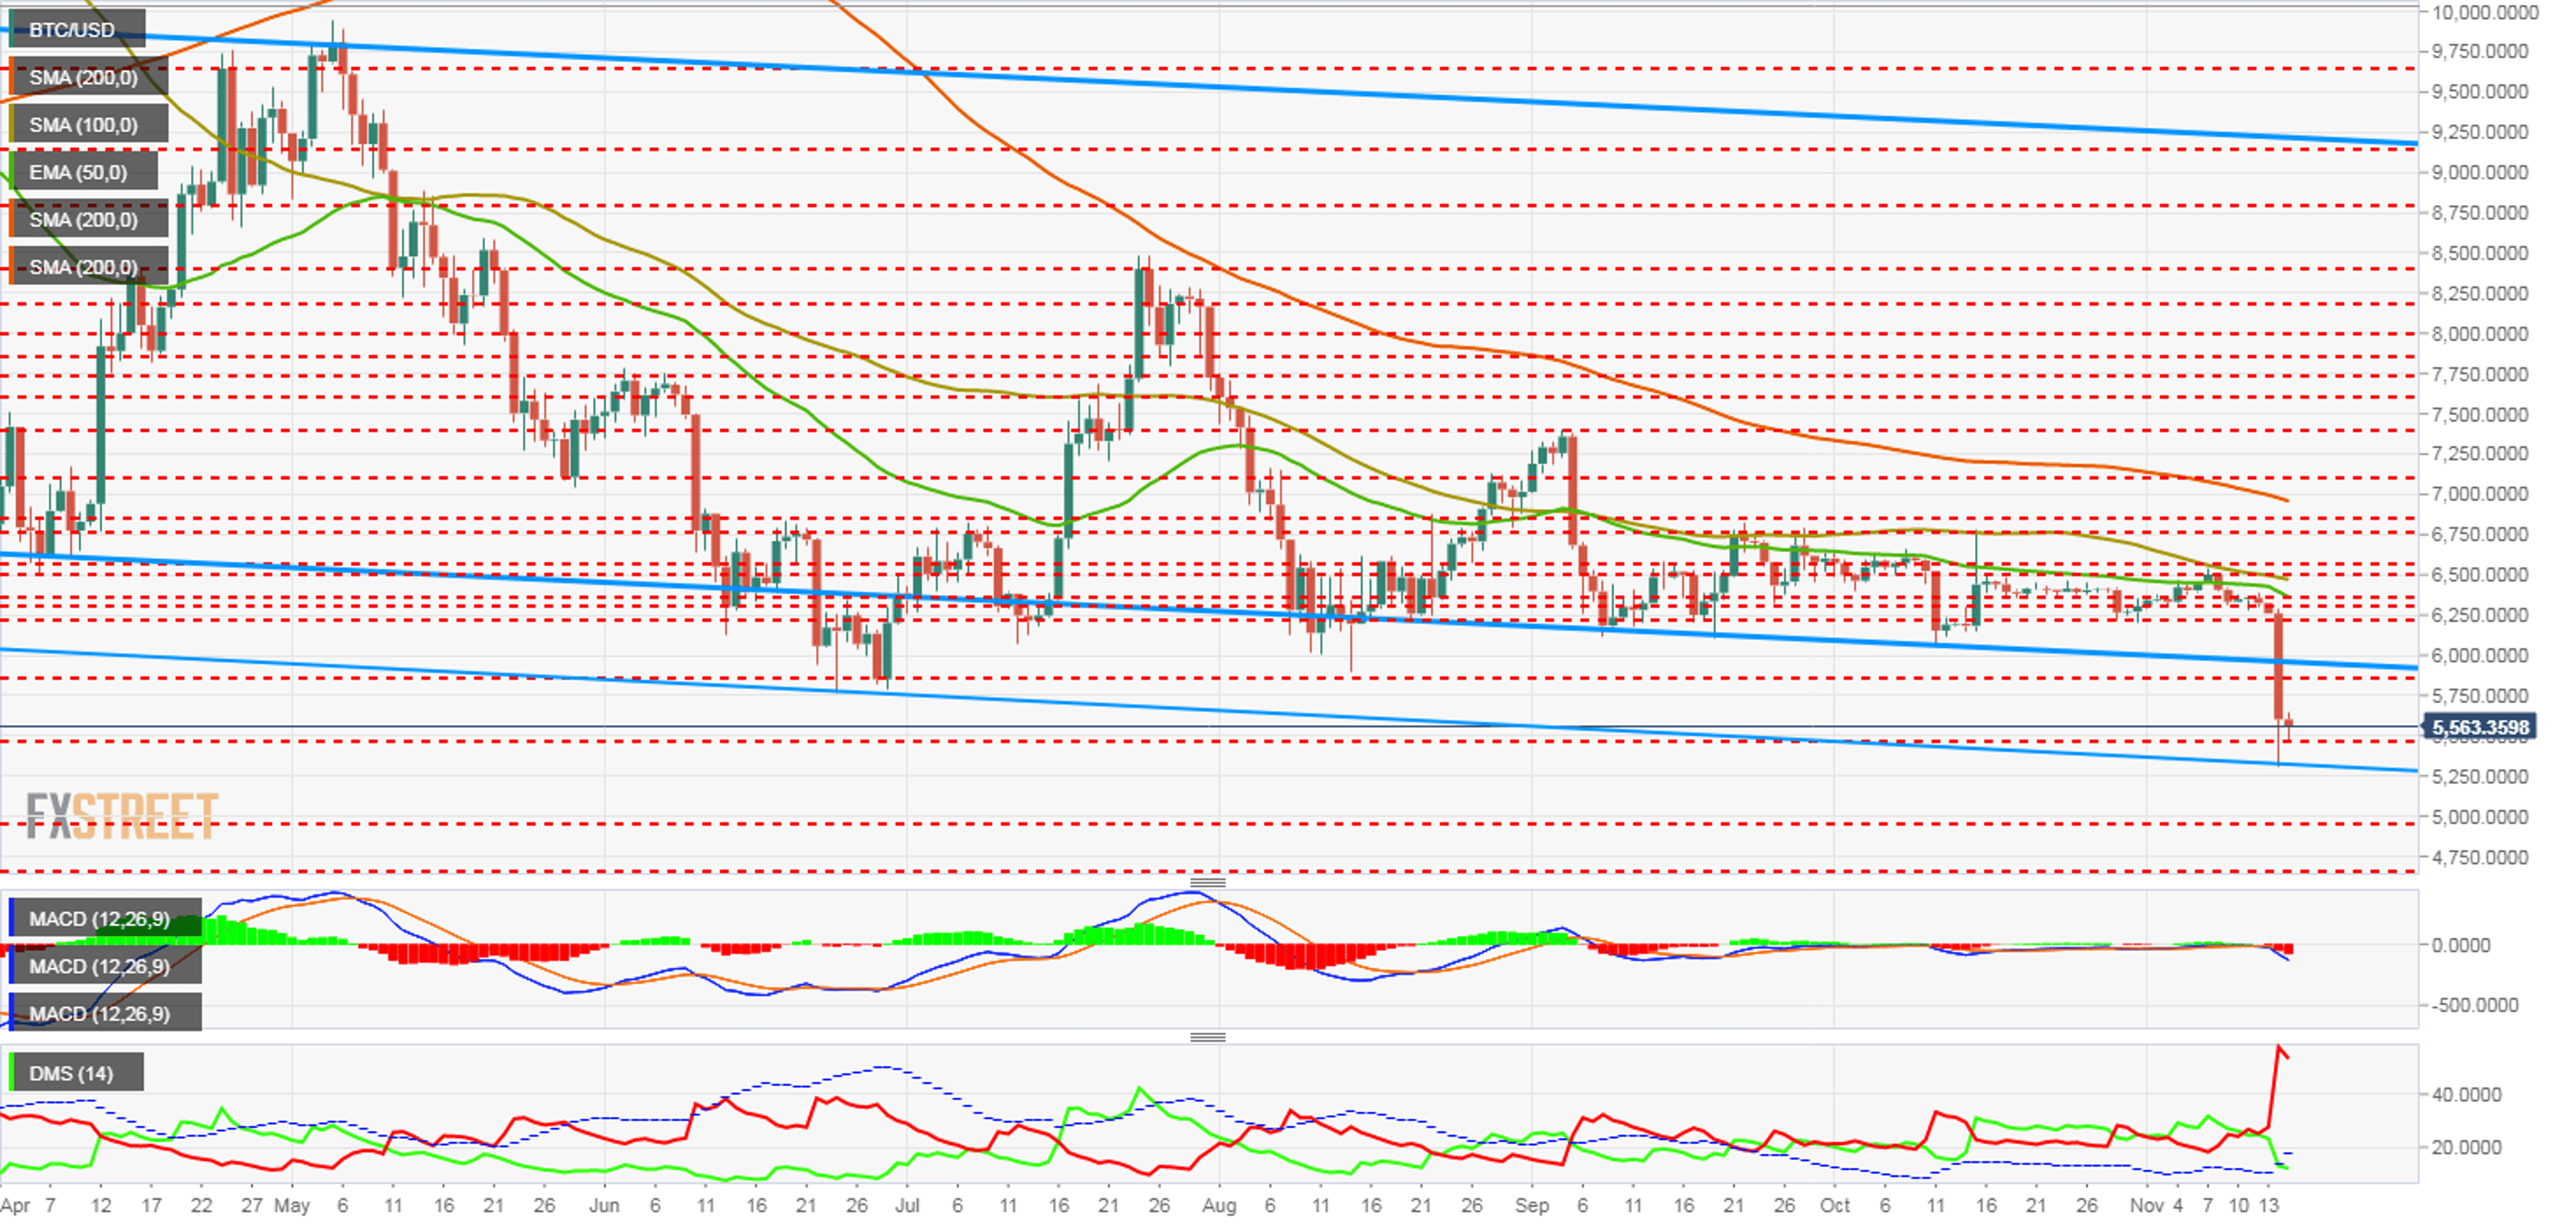
The MACD in the daily range opens downward but to a lesser degree than might be expected. By the opening of lines and inclination, the development of the base movement has a long way to go.
The DMI in the daily range shows that the bears are shooting to levels not seen since February 8, 2016! In comparison, bulls remain at high levels of activity, so we can understand that a small part of the market takes advantage to buy what many others sell.
ETH/USD 1 Day.
The ETH/USD is currently trading at the price level of $179.28. Yesterday it hit a low at $170.81, a level that coincides with price congestion support. The ETH/USD also lost the strong support zone of above $200 and enters a sparser and unstable region.
Ethereum has been moving for months within a large bearish channel. Between the current price and that level, there are only four consistent support levels. The situation is extremely delicate and there is not much margin.
Below the current price, the first support is at yesterday's lows. The second support is $155 (price congestion support). If the ETH/USD loses it, it would open a chasm at its feet and the drop could reach the third big support at $125 (price congestion support). The fourth level of support, at the base of the channel at $100 (price congestion support and bear channel base).
Above the current price, the first resistance is at $191. This is the point of return to the previous price zone. The second resistance at $195.83 (price congestion resistance) and a jump point to the target that would normalize the situation, the third resistance at $210.5 (price congestion resistance).
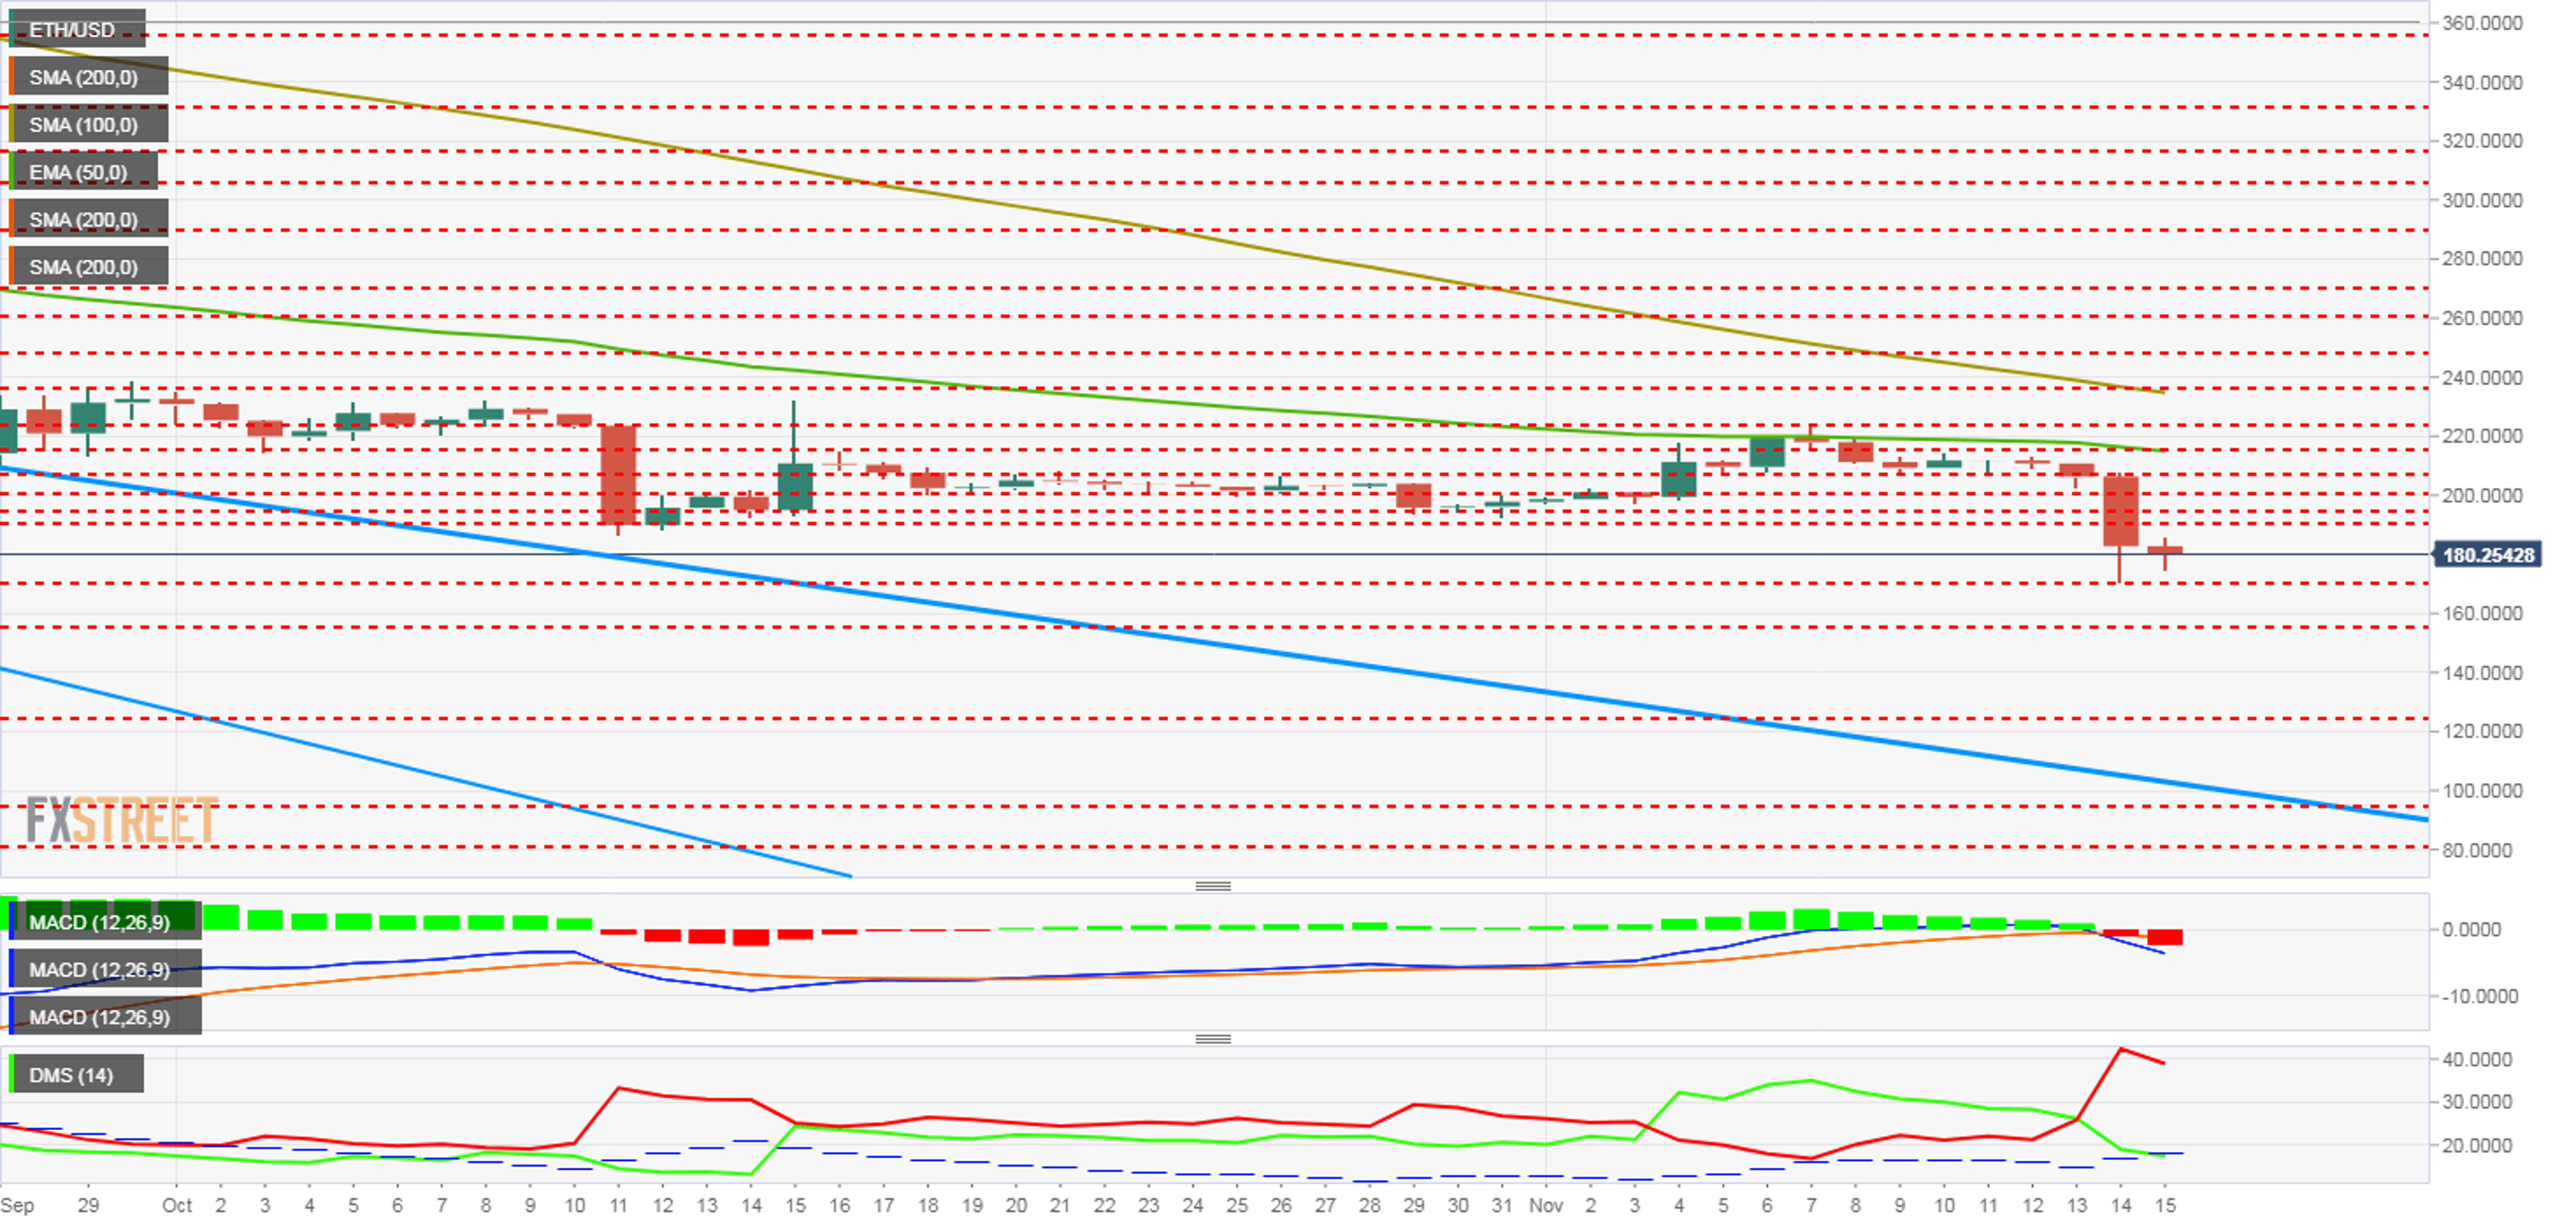
The MACD in the daily range crosses downward but with little inclination and spacing between the lines. The movement appears to have had little impact and it is premature to assess its possible future development.
The DMI in the daily range shows that the bears are in control of the situation, but far from reaching the extremes that we see in the Bitcoin. The bulls, on the other hand, decrease their activity a lot but without reaching levels seen at other times of the year. It seems that the ETH/USD has not suffered as much damage as the BTC/USD.
XRP/USD 1 Day
The XRP/USD is currently trading at the $0.462 price level. It's surprisingly positive because it withstood yesterday's sell-off flawlessly. It touched the base of the long-term bearish channel and managed to close in the first moment above the trend line that governs the movement since the end of June.
Unfortunately, today it opened below and that detracts from its excellent behavior. The long-term chart remains intact although the bullish momentum is lost.
Above the current price, the first resistance is the most important one. It is at the price level of $0.478 and a move above it would put the XRP/USD back on the rocket launch platform. The second resistance in the Simple Moving Average of 200 periods at $0.49. The third resistance at $0.506 (price congestion resistance).
Below the current price, the first support is at the lows of the day at $0.443 (price congestion support). The second support is at $0.43 (price congestion support). The third support is at $0.414 (price congestion support and yesterday's lows).
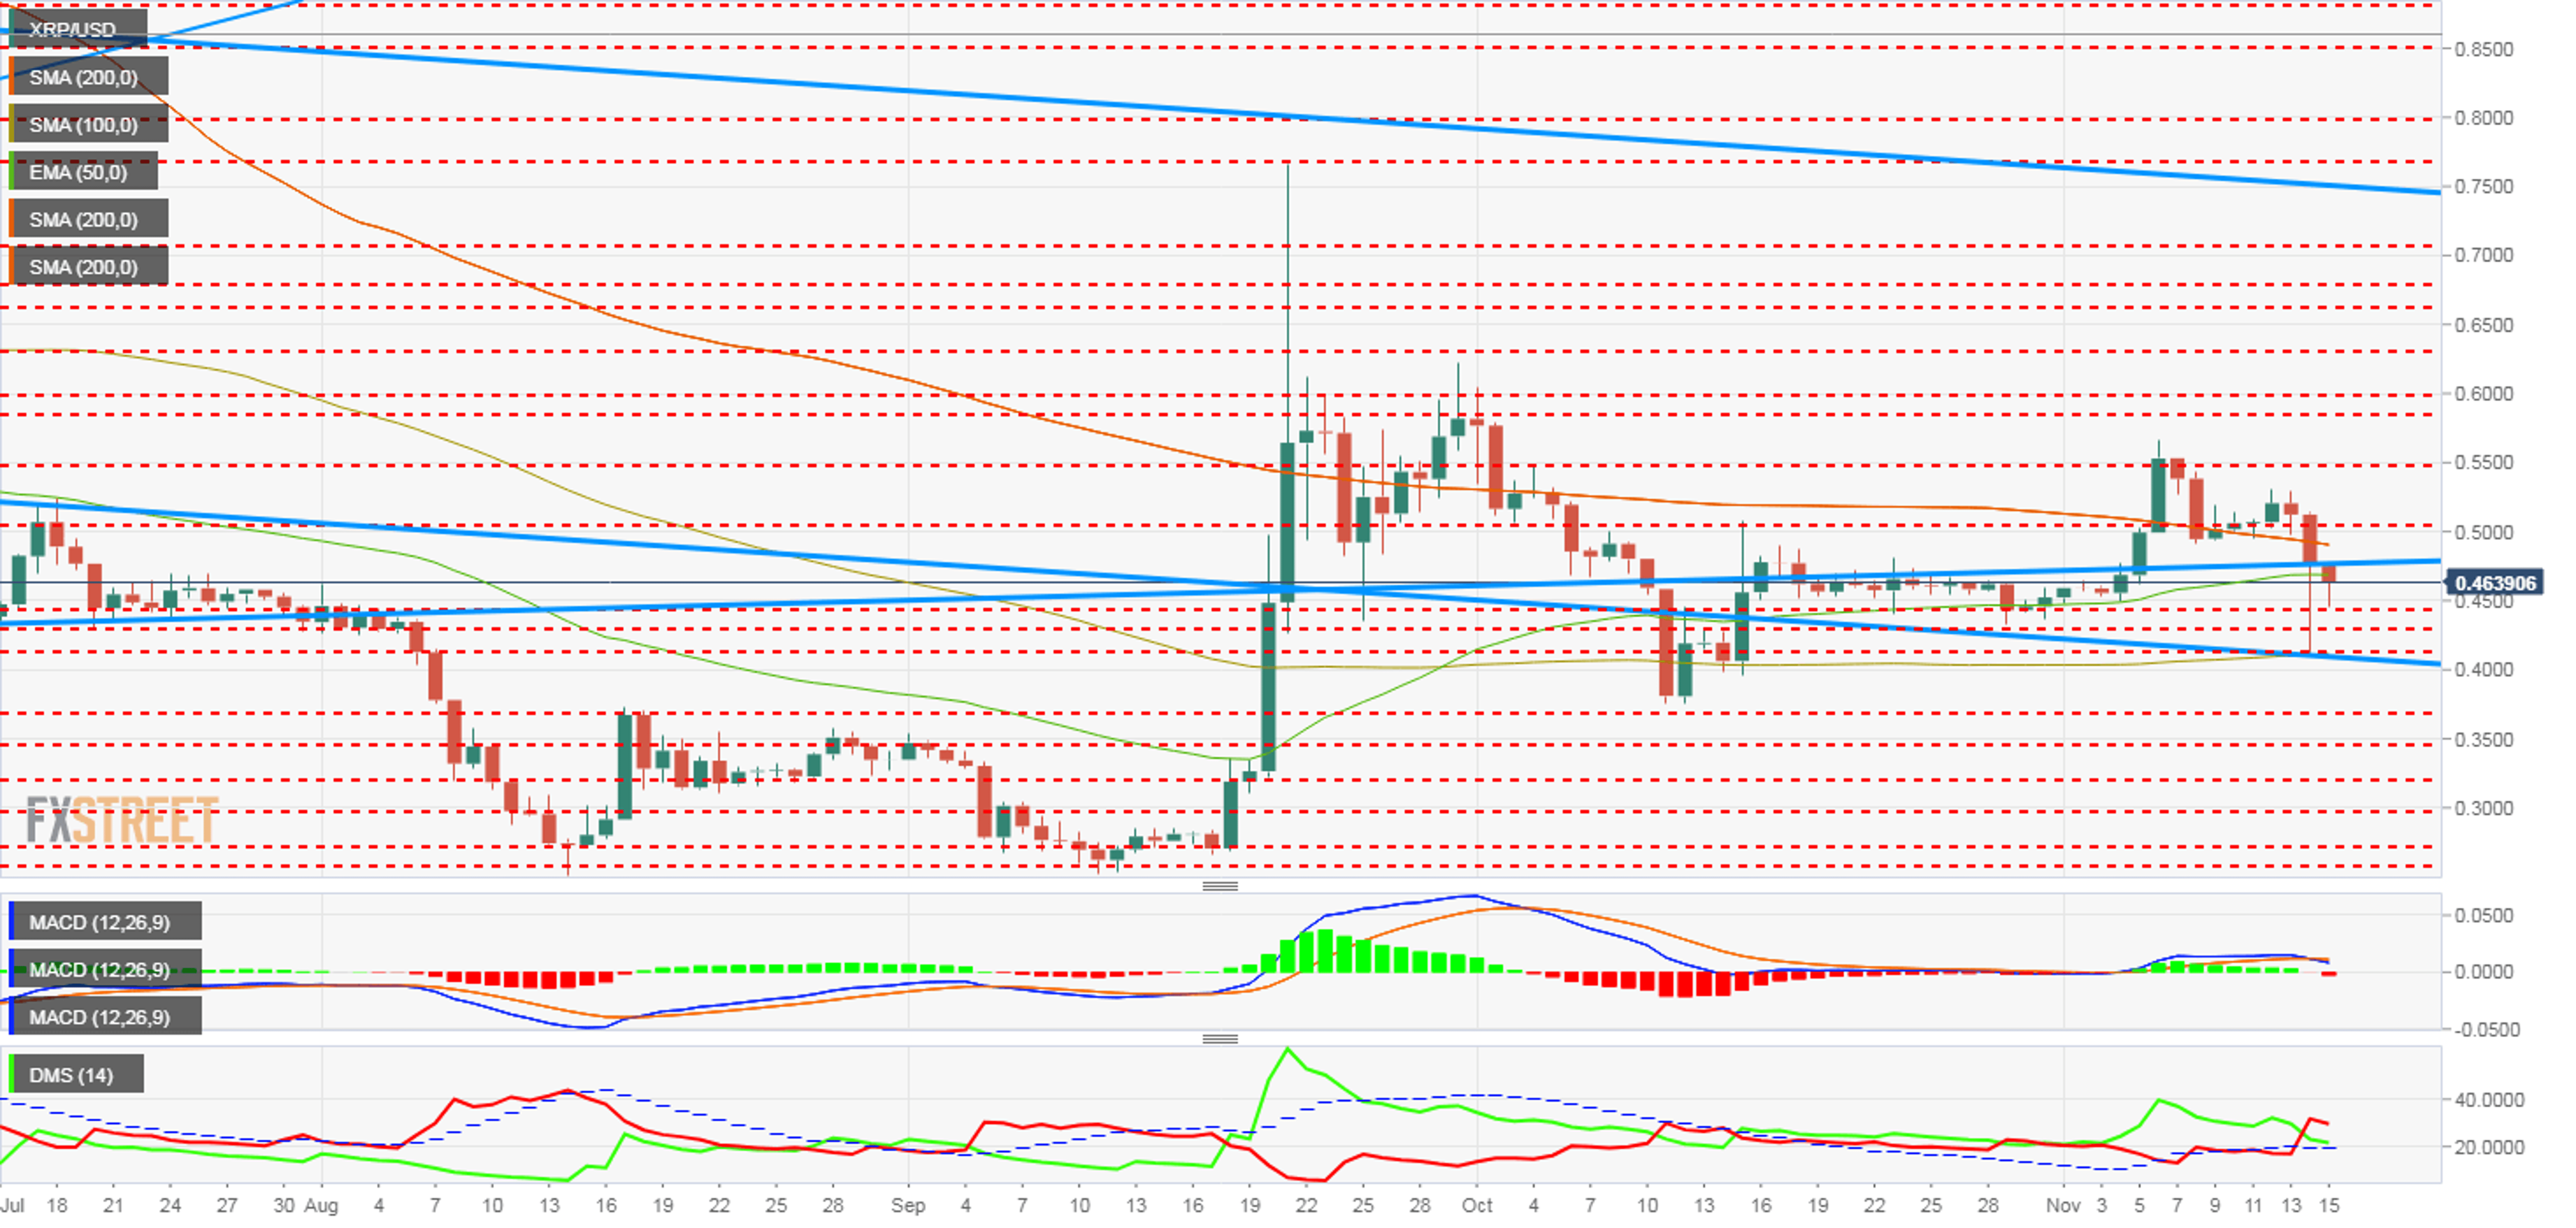
The MACD in the daily range crosses downward but continues to be in the positive range of the indicator. It is supported at the neutral level and therefore indicates a sideways behavior with a bullish background.
The DMI in the daily range shows the bears taking control but with little advantage over the bulls. Both remain above an ADX that does not reach above the 20 level signaling the existence of an ongoing trend. This situation suggests laterality with a bearish background. There is confusion among market participants.
Get 24/7 Crypto updates in our social media channels: Give us a follow at @FXSCrypto and our FXStreet Crypto Trading Telegram channel
© 2024 Benzinga.com. Benzinga does not provide investment advice. All rights reserved.
Trade confidently with insights and alerts from analyst ratings, free reports and breaking news that affects the stocks you care about.

