


Loading...
Loading...
Oil's grip on the stock market means that even investors who stay clear of volatile commodities trading can see their fortunes rise and fall with "black gold."
As stock investors become de facto oil prospectors, many find themselves asking: Why do sharp moves in crude prices—including the dive that more than halved the price to below $50 a barrel in six short months—sometimes correlate with broad stock movement and other times don't?
Several factors come into play, including timing of the economic cycle, whether an investor has considerable exposure to the energy sector, and whether the energy picture greatly shapes how they look at the global economy and global stock markets.
What we do know is that inter-market analysis—or how stocks, bonds, commodities, and currencies relate to one another—matters. Case in point: Moody's Analytics estimates that appreciation of the U.S. dollar accounts for about 15% of the decline in crude oil prices.
As Energy Went, So Did Stocks
Energy share worries drowned out the much quieter murmurings about a reenergized consumer who would presumably parlay cheaper gas-pump and electricity prices into spending on their homes, far-flung travel, and bigger cars, all of which would help consumer stocks. Why did worry prevail? The sting of weaker oil shows up right away in energy shares and in the
S&P 500 ($
SPX). Take
Exxon Mobil ($
XOM), the world's second largest publicly held company. It accounts for over 25% of the S&P 500 energy sector, says S&P Capital IQ, and over 2% of the S&P 500. And that's just one oil company.
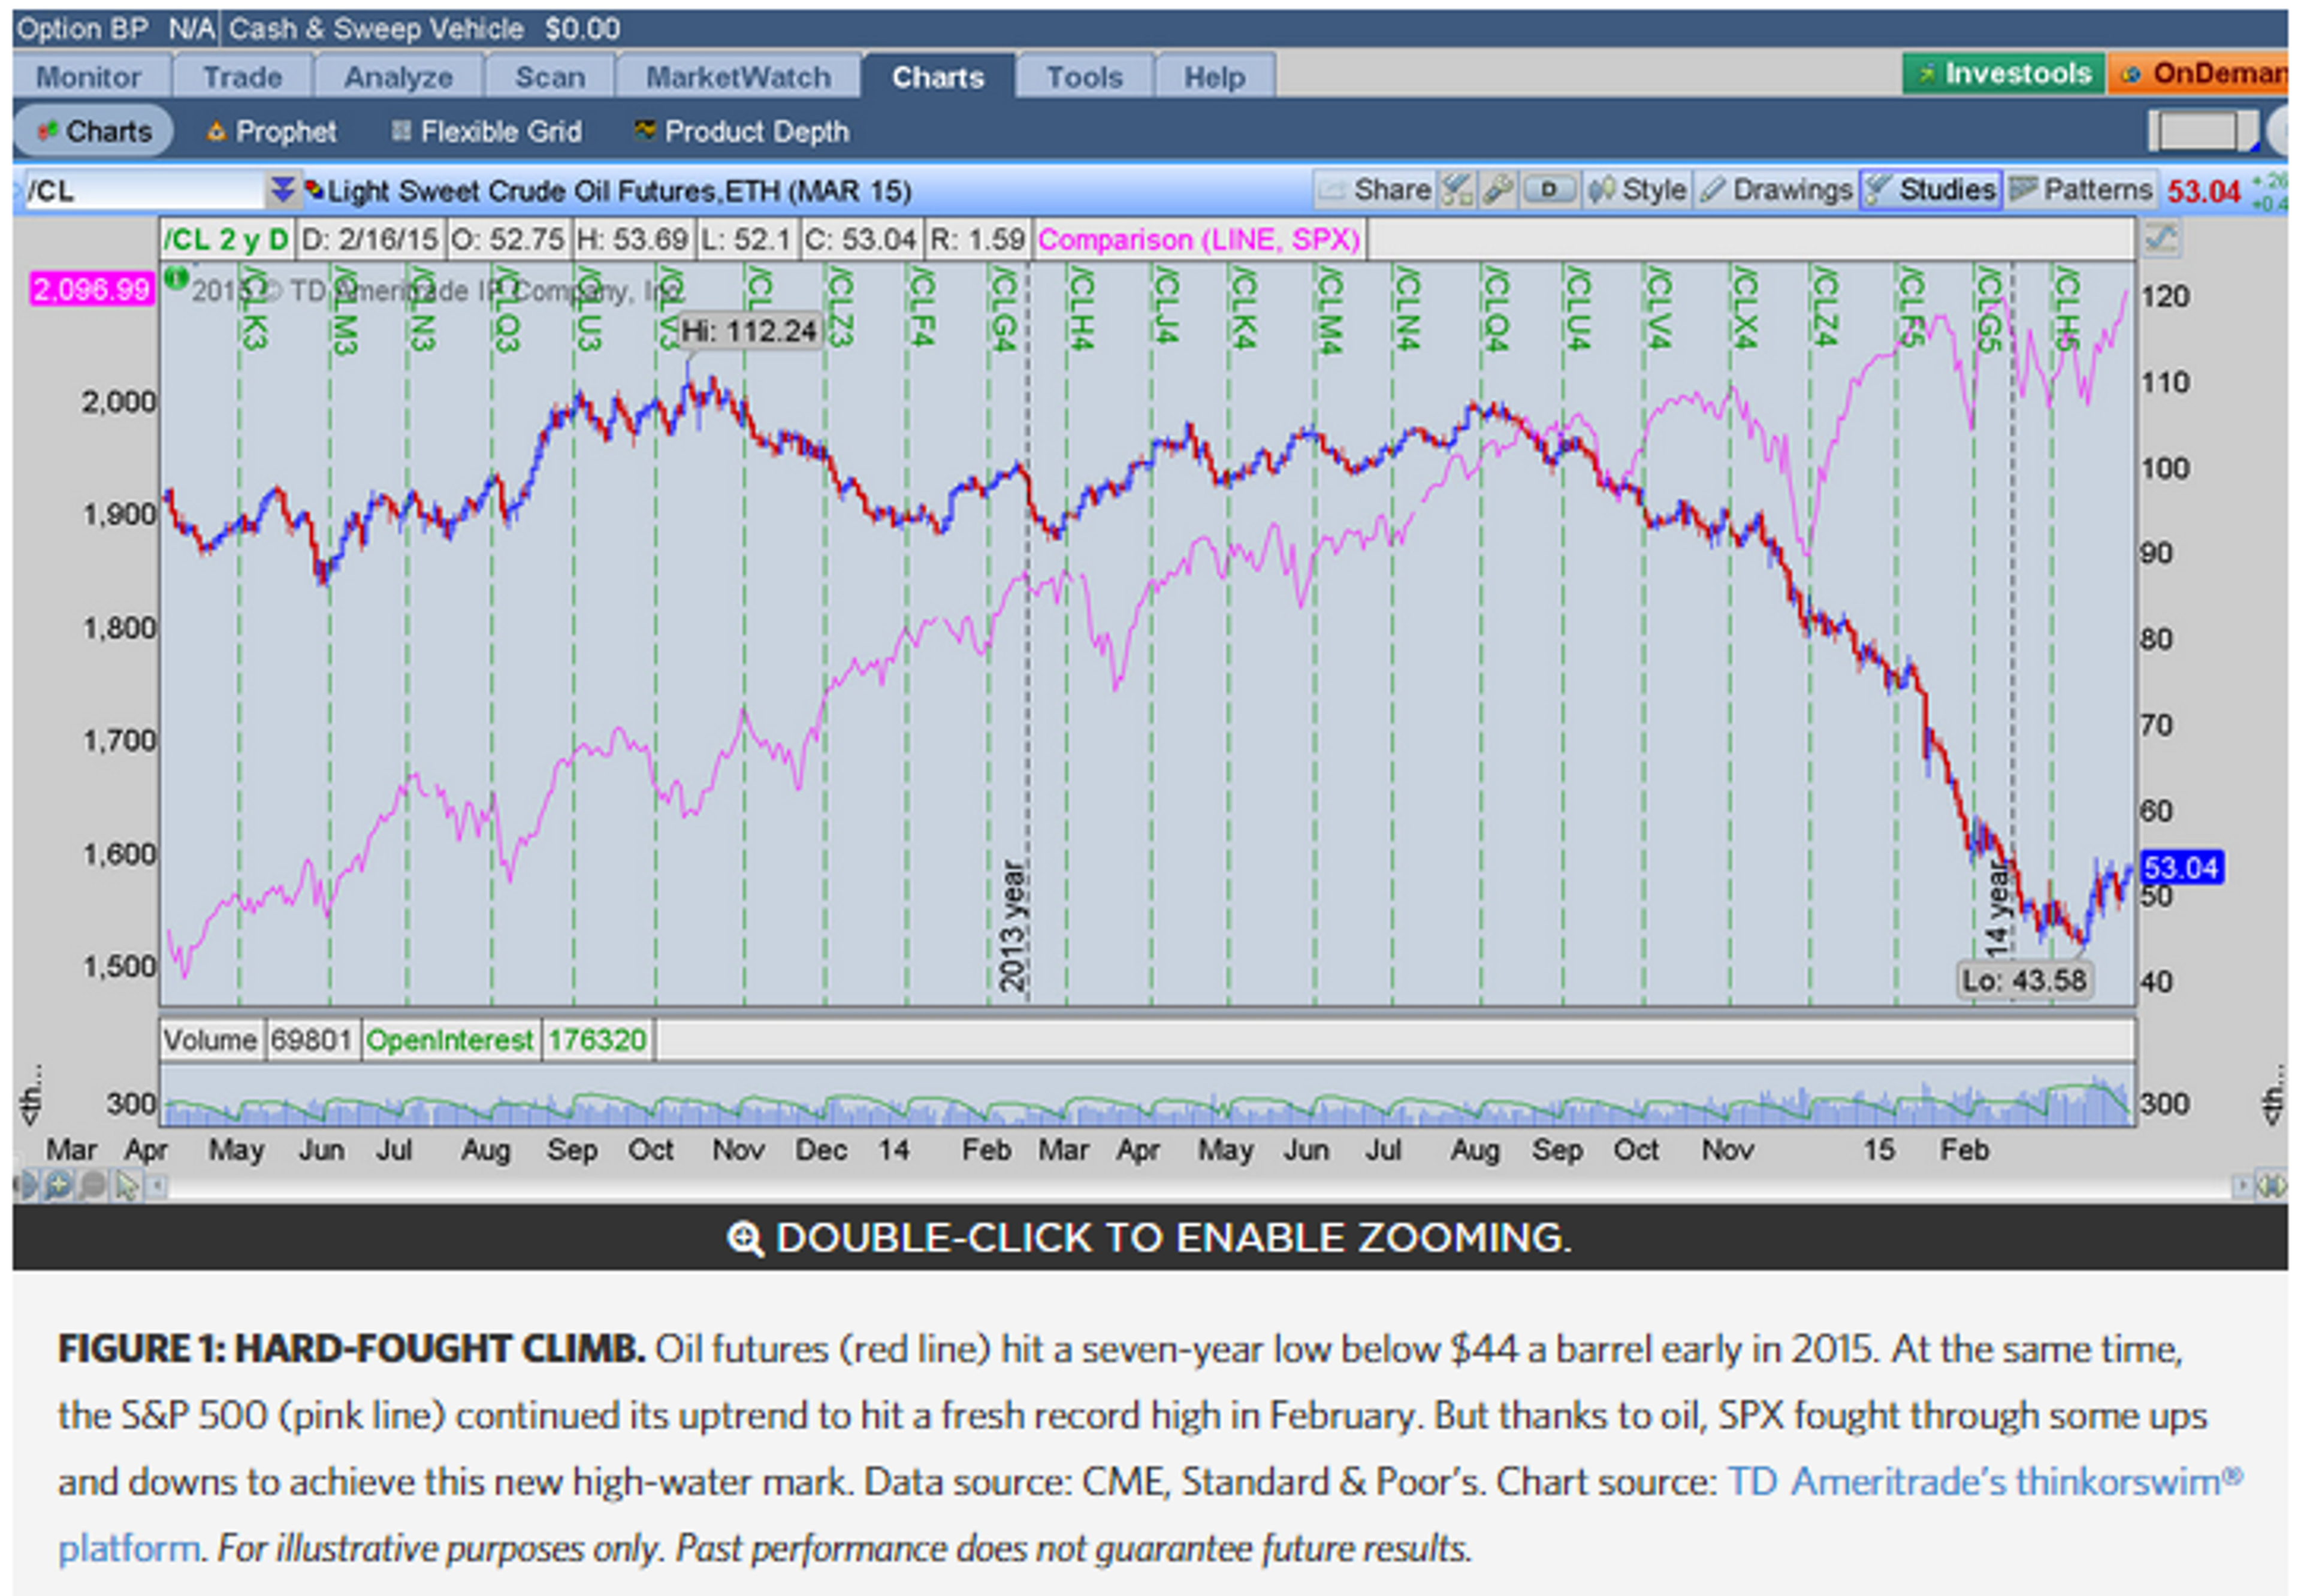
In late 2014 and early 2015, energy share weakness, which tracked the plunge in crude prices, brought pause to the SPX's record climb (see figure 1). The S&P index of 80 oil and gas exploration companies was down roughly 11% year to date through mid-February and down 35% over 52 weeks. The S&P index of six large oil services companies had fallen 5.2% in 2015 through mid-February, down just over 12% from one year before. In that span, the SPX shaved about 1.8% before regrouping to a fresh record. It was a mild—emphasis on mild—bounce in energy prices that appeared to give bulls the all-clear to take SPX to a fresh record high in mid-February.
"The correlation between the oil market and the S&P 500 continued for much of early 2015, evident in a mid-January sell-off triggered in part by Goldman Sachs' fresh haircut for its oil prediction," said JJ Kinahan, Chief Strategist at TD Ameritrade.

Oil Greases Industrial Sector
Notably, oil sensitivity extends to the manufacturing and transportation companies that supply the energy industry. And then there are those companies that have to buy oil and related products to operate. Still, oil is something of a basic good, and companies don't necessarily immediately raise or lower prices on their goods and services as soon as these expenses go up and down. For one thing, they have to keep an eye on whether competitors' prices are changing, too.
Because oil seems to raise and lower costs for every participant in the economy, it has both an inflationary and disinflationary effect over the long term. That's a two-sided proposition: rising costs might put downward pressure on profits, hurting the stock market, but because stocks are a "claim" on real assets contained in a company, the price can rise with inflation because the market value of these assets rises. Of course, once inflation bubbles up to extreme levels, there's little positive news left in most stocks. On the other hand, low oil prices also hold back inflation expectations. In that case, low oil is a positive for cyclical stocks, particularly consumer cyclicals.
The best way for investors to keep track of these oil-related costs and savings and potential stock impacts is to listen for post-earnings comments from management. On their earnings calls, oil producers warned of job cuts and announced capital spending pullbacks and falling rig counts. Industrial giants whose substantial businesses supply the energy industry made it clear they'd sacrifice a little low inflation for confidence that their contracts would hold up in the face of weak crude prices.
So, Where Is That Consumer Bump?
It's harder, or at least it takes longer, to see the positive impact of cheaper jet fuel, gasoline, and natural gas spread through the manufacturing and retail economies. But eventually this "good" news does trickle down to stock markets, too. Some economists have said price drops in gasoline have taken up to six months to appear in the form of strong consumer spending on other goods.
It's presumed that if consumers are spending less on gasoline, they can spend more elsewhere; in fact, lower pump prices can exponentially lift consumer spending simply because of increased confidence. Census Bureau data shows that the 2014–15 drop in oil prices could on average equate to a $600 per-household "tax cut." That matters, because the discretionary income of the U.S. consumer accounts for more than two-thirds of GDP.
Loading...
Loading...
Gas to Stay Below $3?
Gasoline on average in early February was listed at just over $2 per gallon, still over $1.20 cheaper than one year ago, according to trade group AAA. AAA forecasts that the national average of gasoline is expected to rise in the coming months due to a seasonal demand increase and refinery maintenance. But the U.S. average will remain below $3 per gallon throughout 2015.
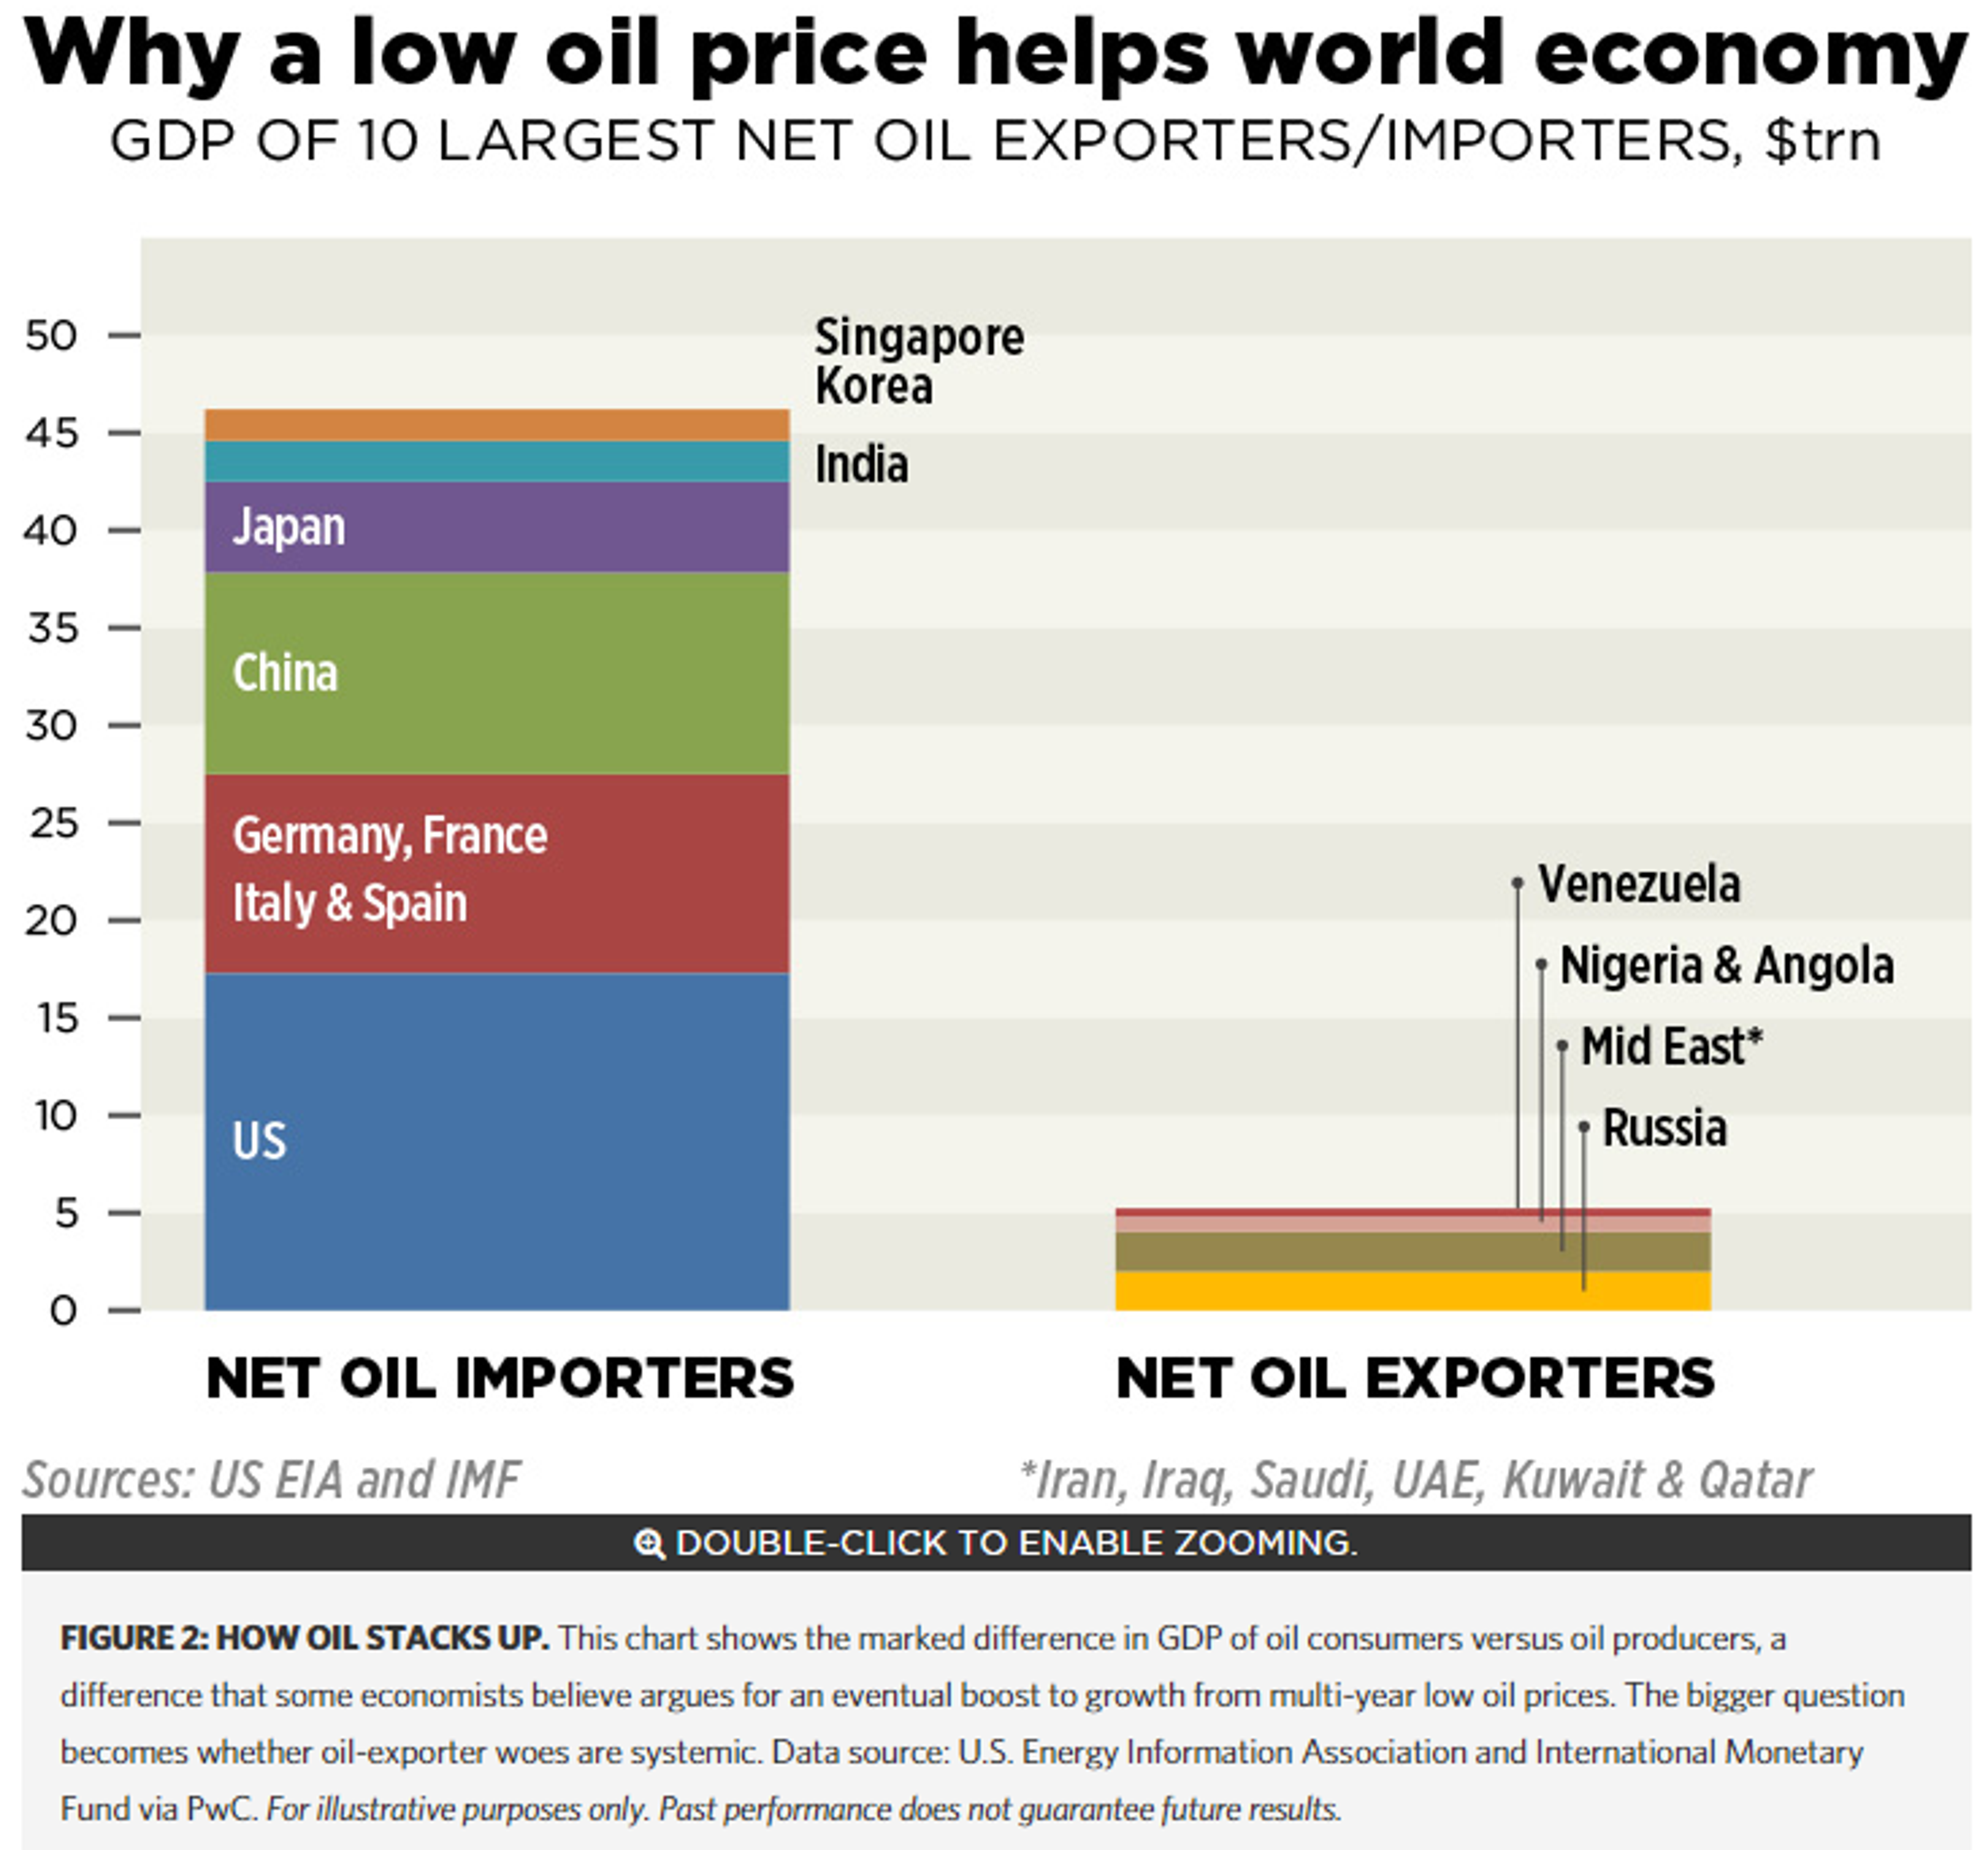
And we're not just talking about the U.S. consumer. "Countries which are net oil consumers are much more important to the world economy than oil producers," said Andrew Sentance, senior economic adviser at U.K.-based PwC. He's charted the difference (see figure 2).
"A fall in the oil price of the magnitude we have seen since the summer should create a boost to GDP of around 1% over the next couple of years in the major advanced economies—U.S., Europe, and Japan," he said. "It should also benefit consumers in large emerging market economies which are net oil importers—notably China and India."

At the end of the day, the impact of cheaper oil on consumers is a bigger deal than the impact on the energy industry, especially longer term. According to government data, investment in oil and gas structures (remember, it's the big boom in U.S. production that's largely behind the global crude price drop) has become 30% of all nonresidential structure investment in the U.S., but that translates to less than 1% of total GDP. And while employment in the energy industry has grown rapidly in tandem with the surge in production, this segment has accounted for just 2.5% of total jobs added to the labor force since the end of the recession, Labor Department statistics show.
Far-Reaching Impact
What does it all mean for investors? The intricate relationship between producer and consumer can make it tough to figure out when oil is a macro story (driving stocks because of implications for global economic strength or U.S. consumer spending) and when it's a micro story (when tumbling energy stocks tug the SPX lower or higher).
The first step is finding out how much of your portfolio is exposed to oil. Tracking commodities markets and the commentary from those buying and selling oil and its many by-products is a good idea, too.
Remember, oil sticks, in one way or another, to just about every financial instrument out there.
This piece was originally posted here by Rachel Koning-Beals on March 11, 2015.Loading...
Loading...
© 2024 Benzinga.com. Benzinga does not provide investment advice. All rights reserved.
Benzinga simplifies the market for smarter investing
Trade confidently with insights and alerts from analyst ratings, free reports and breaking news that affects the stocks you care about.
Join Now: Free!
Already a member?Sign in

