


The iShares Barclays 20+ Yr Treas.Bond (ETF) TLT has broken out to new all-time highs in June. However, the ETF’s chart indicates the run-up may be on a breather for the time being.
After forming a double top at $134 in early 2015 and early 2016, TLT broke through the $134 level with authority earlier this month and surged to new all-time highs.
The ETF climbed as high as $137.56 in Thursday morning trading before pulling back to the mid-$136 range.
The bad news for TLT bulls is that the ETF may be forming a shooting start technical formation on Thursday. A shooting star is a candlestick formation that forms when a stock or ETF advances well above its opening price throughout the trading day only to pull back and close below the opening price. This formation typically marks near-term market tops and reversals.


If the TLT’s current price holds, the ETF will form a shooting start candle on Thursday.
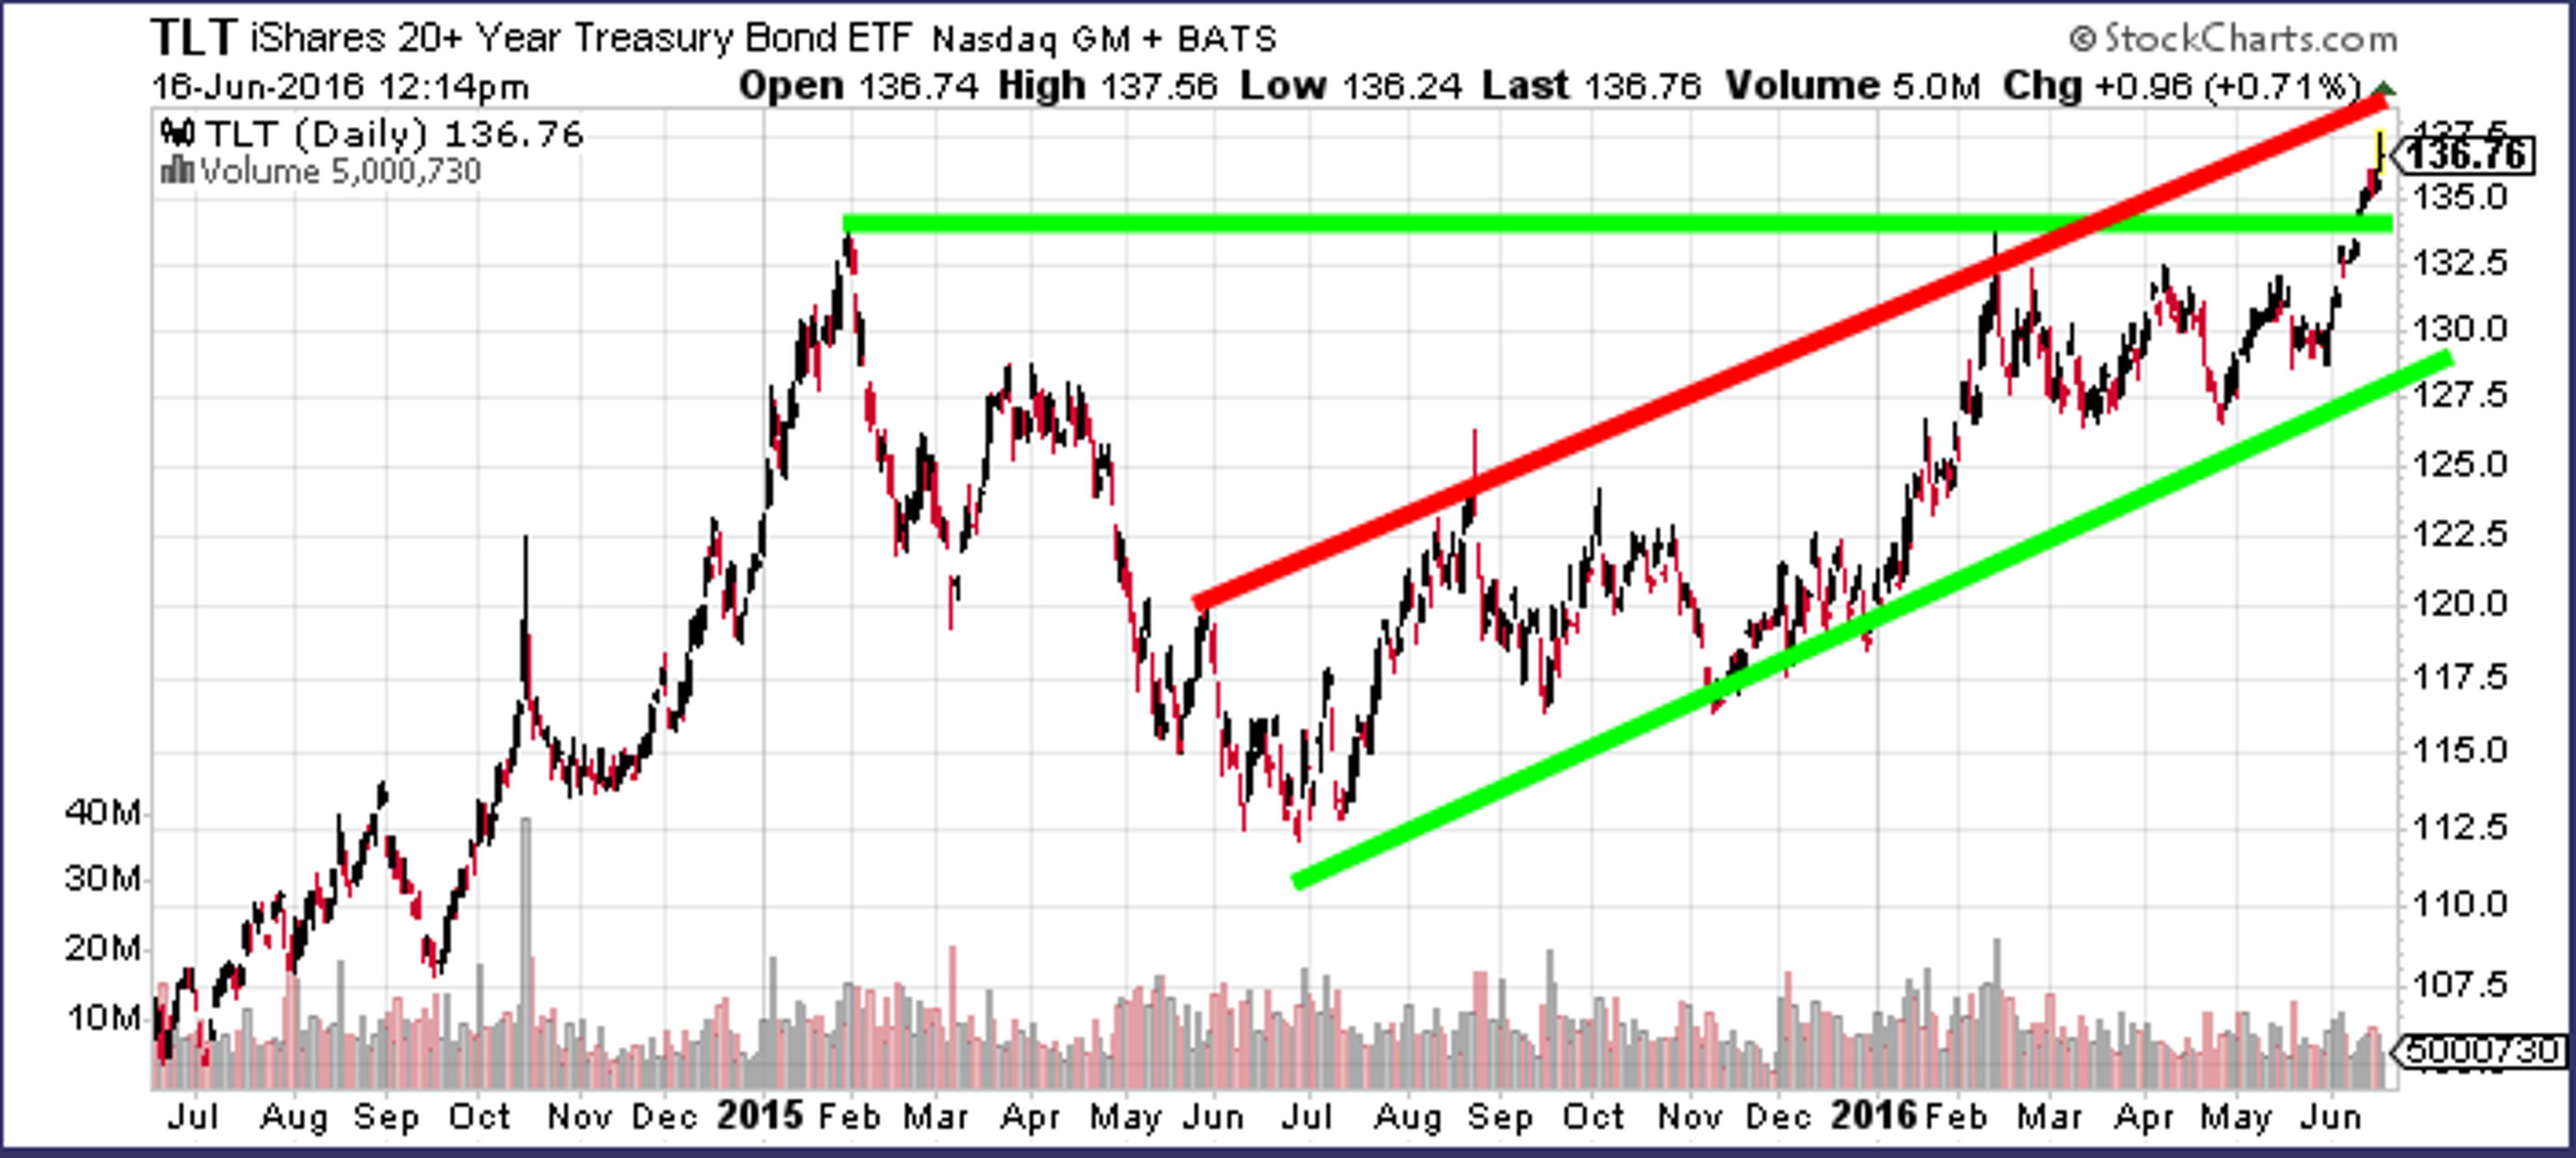
The good news for TLT bulls is that the ETF’s former resistance at the $134 level should now provide a certain degree of support in the event of a pullback. If the $134 level holds, it’s likely that the bull run will continue at some point in coming weeks.
Disclosure: The author holds no position in the stocks mentioned.
© 2024 Benzinga.com. Benzinga does not provide investment advice. All rights reserved.
Trade confidently with insights and alerts from analyst ratings, free reports and breaking news that affects the stocks you care about.

