


Editor’s note: This is the first of two articles covering market sentiment measures.
Are you one of those investors who are glued to CNBC first thing in the morning? Always wondering what's trending in the world of finance? There are times in life when it’s OK to go along with the crowd. And then there are occasions when going against the investing herd might make sense.
You can start by sizing up the collective mood of the majority. Later, you’ll decide what to do with that information. The go-to measure of the stock crowd’s state of mind has long been the CBOE Volatility Index (VIX), affectionately known as the “fear” gauge. It’s earned its status as king of the sentiment indicators, industry analysts agree. But for the curious investor, there's a lot more to market sentiment than just the VIX.


Finding Those Extremes
Sentiment analysis aims to quantify levels of optimism and pessimism, which can help investors make logical decisions at emotional market turning points. The VIX and other sentiment indicators are generally utilized as contrarian indicators—potential clues for when it’s time to go against the crowd.
Contrarian investing is based on the premise that one should buy when others are fearful and sell when others are eager to buy. It’s a concept Warren Buffett made famous. And there’s a familiar jingle: “When the VIX is high, it’s time to buy. When it’s low, it’s time to go.”
Of course, it’s much harder to define “extremely low” and “extremely high.” One approach is to overlay a VIX chart on the S&P 500 (SPX) for some long-term history. Check to see when the market has turned at various VIX levels.
If you are looking to stretch beyond the VIX, the CBOE also tracks about 30 different volatility indexes that can offer sentiment insight—from NASDAQ stocks to 10-year Treasury notes to crude oil and even Apple AAPL. Yes, that’s sentiment just for Apple stock.
The NASDAQ Fear Gauge
For investors who are already accustomed to tracking the VIX, the CBOE's VXN (NASDAQ-100 Volatility Index) is based on the same concept and used in a similar way.
"The VXN is basically the VIX of the NASDAQ, meaning the same calculation is done using NASDAQ index options instead of the S&P 500. The interpretation is the same: high readings indicate a high degree of fear, low readings indicate a lack of fear," says Devin Ekberg, content manager at Investools®*.
Equity investors might use the VXN as a contrarian indicator to help inform their trading decisions for technology stock positions, as many of the leading technology names make up the NASDAQ index.
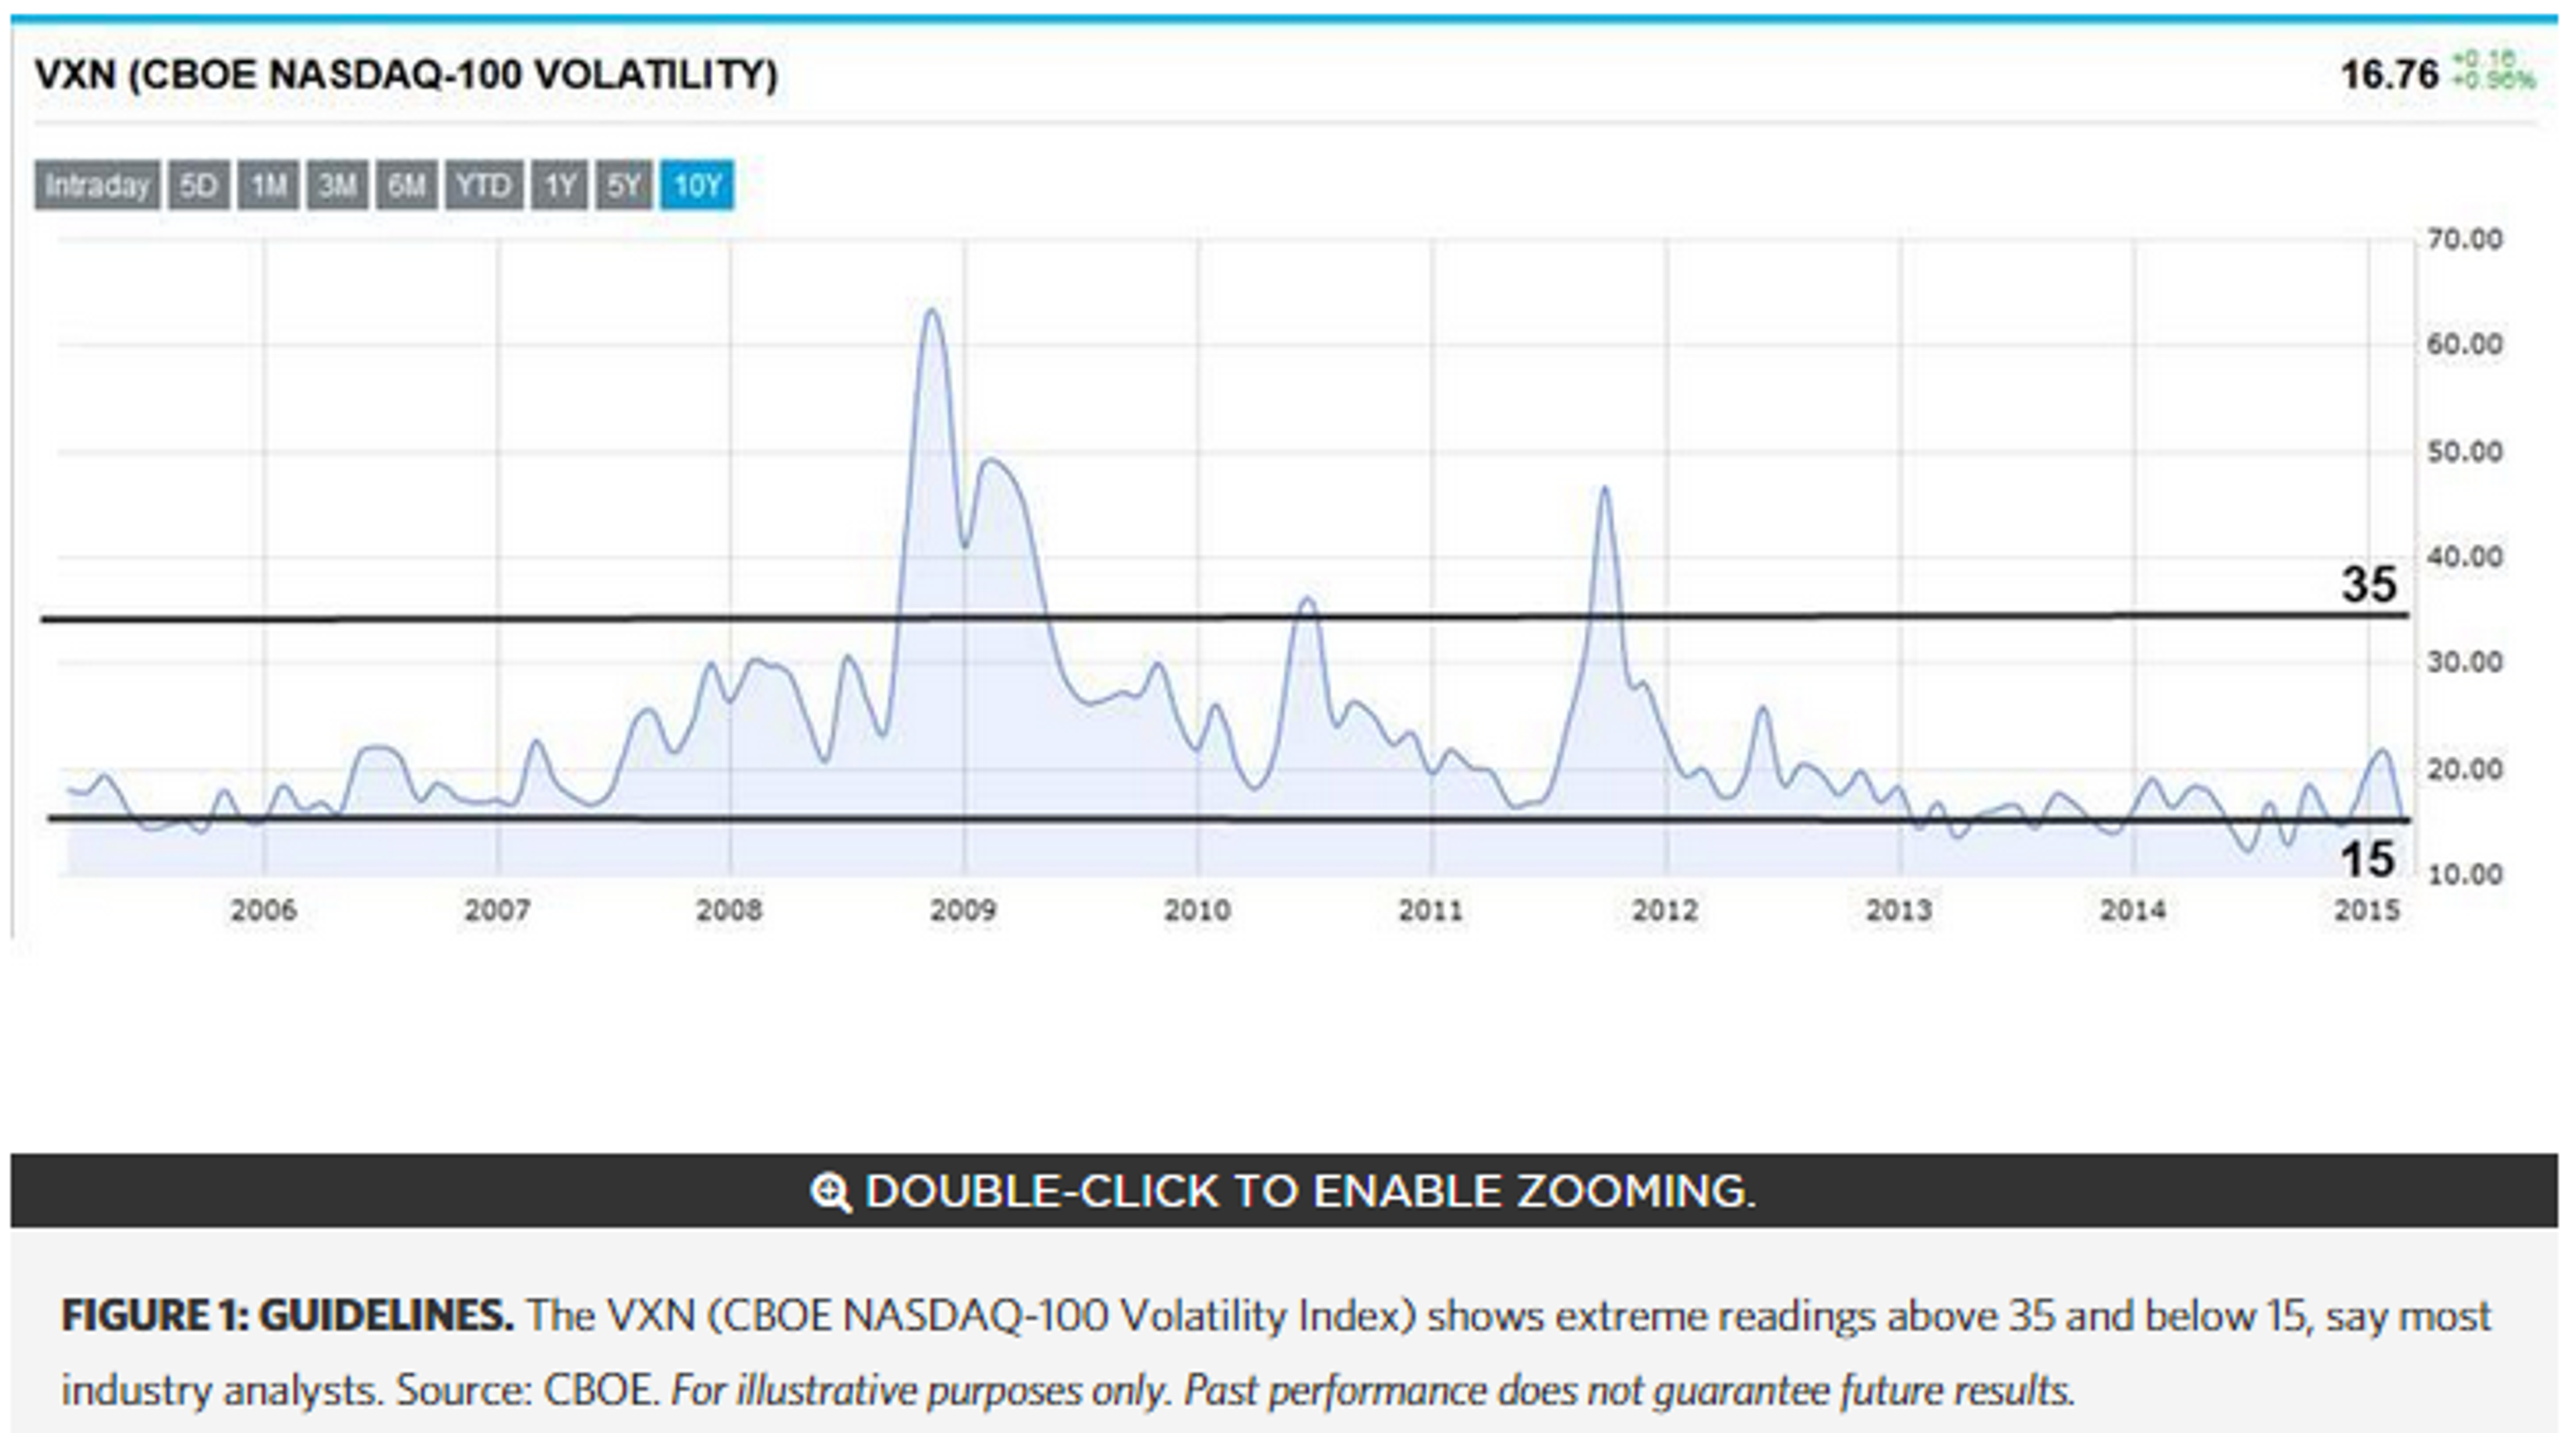
VIX’s extreme low readings are pegged in the 12 to 10 range or below, say industry analysts. Those levels are typically seen during a strong bull market. At the other end, a 25 to 30 reading is a historical extreme high, which generally reveals investors are pricing in high levels of uncertainty. Key levels for traders to monitor in the VXN are above 35 for an extreme high and below 15 for extreme lows (figure 1).
"High extremes, or when people are fearful, can typically be a good time to buy, the consensus says. While lower levels, or when people are complacent, or there is a general lack of fear, is typically a time to sell," Ekberg says.

10-Year Treasury Note Volatility Index
As the Federal Reserve readies for its first rate hike since the global financial crisis hit in 2008, there has been heightened interest surrounding the direction of long-term interest rates.
If you are looking for clues on investor sentiment about long-term interest rates, the CBOE/CBOT 10-year U.S. Treasury Note Volatility Index (VXTYN) could be a place to start. This index measures the expected volatility of the price of 10-year Treasury note futures. The 10-year is considered a benchmark interest rate from which mortgage and other lending rates are set. "There is a lot of volatility around interest rates, and an extreme high may indicate people are fearful that interest rates are about to rise," Ekberg says.
On the flip side, "an extreme low means people are somewhat complacent and they expect interest rates will be lower forever, which is probably not realistic," Ekberg says. As of late March, the VXTYN stood around 6, with extreme highs seen above 8 and extreme lows at 4 (figure 2).


Inform Your Trading Decisions
Sentiment tools—and we’ve covered just a few here—offer unique insights into investor thinking and important clues for potential market turning points. These indicators help pinpoint extremes in investor optimism and pessimism, but experts caution against using sentiment as the sole trigger for an investing decision. These tools work well in combination with your favorite fundamental or technical indicators and should always be considered in the context of your investing goals and risk tolerance.
"For example, if an investor observes a complacent lack of fear [low reading] in VXN and also happens to hold a few NASDAQ stocks with very high valuation ratios, she might consider taking some profits at that point,” says Ekberg. “Likewise, if an investor observes a spike in fear [high reading] in VXN and notices a few NASDAQ stocks with an attractive technical pattern, he might consider buying them.”
Keep in mind that greed helps fuel market tops and fear helps create market bottoms. Sentiment tools attempt to quantify extremes in investor optimism and pessimism and can help keep you from getting stuck on the wrong side of the crowd.
In Part 2, we’ll look at sentiment measures specific to retail investor decision-making.
This piece was originally posted here by Kira Brecht on May 21, 2015.
This information is not intended to be investment advice or construed as a recommendation or endorsement of any particular investment or investment strategy, and is for illustrative purposes only. Be sure to understand all risks involved with each strategy, including commission costs, before attempting to place any trade. Clients must consider all relevant risk factors, including their own personal financial situations, before trading.
The discussion of specific securities is not intended to be a recommendation to buy, sell, or hold a specific security.
Past performance of a security or strategy does not guarantee future results or success.
TD Ameritrade, Inc., member FINRA/SIPC. TD Ameritrade is a trademark jointly owned by TD Ameritrade IP Company, Inc. and The Toronto-Dominion Bank. © 2015 TD Ameritrade IP Company, Inc. All rights reserved. Used with permission.
© 2024 Benzinga.com. Benzinga does not provide investment advice. All rights reserved.
Trade confidently with insights and alerts from analyst ratings, free reports and breaking news that affects the stocks you care about.

