


Facebook Inc FB stock has been on quite a tear since it hit post-IPO lows in the high teens in late 2012. Shares hit an all-time high on Monday morning.
Facebook is now up more than 350 percent from those levels in about two years.
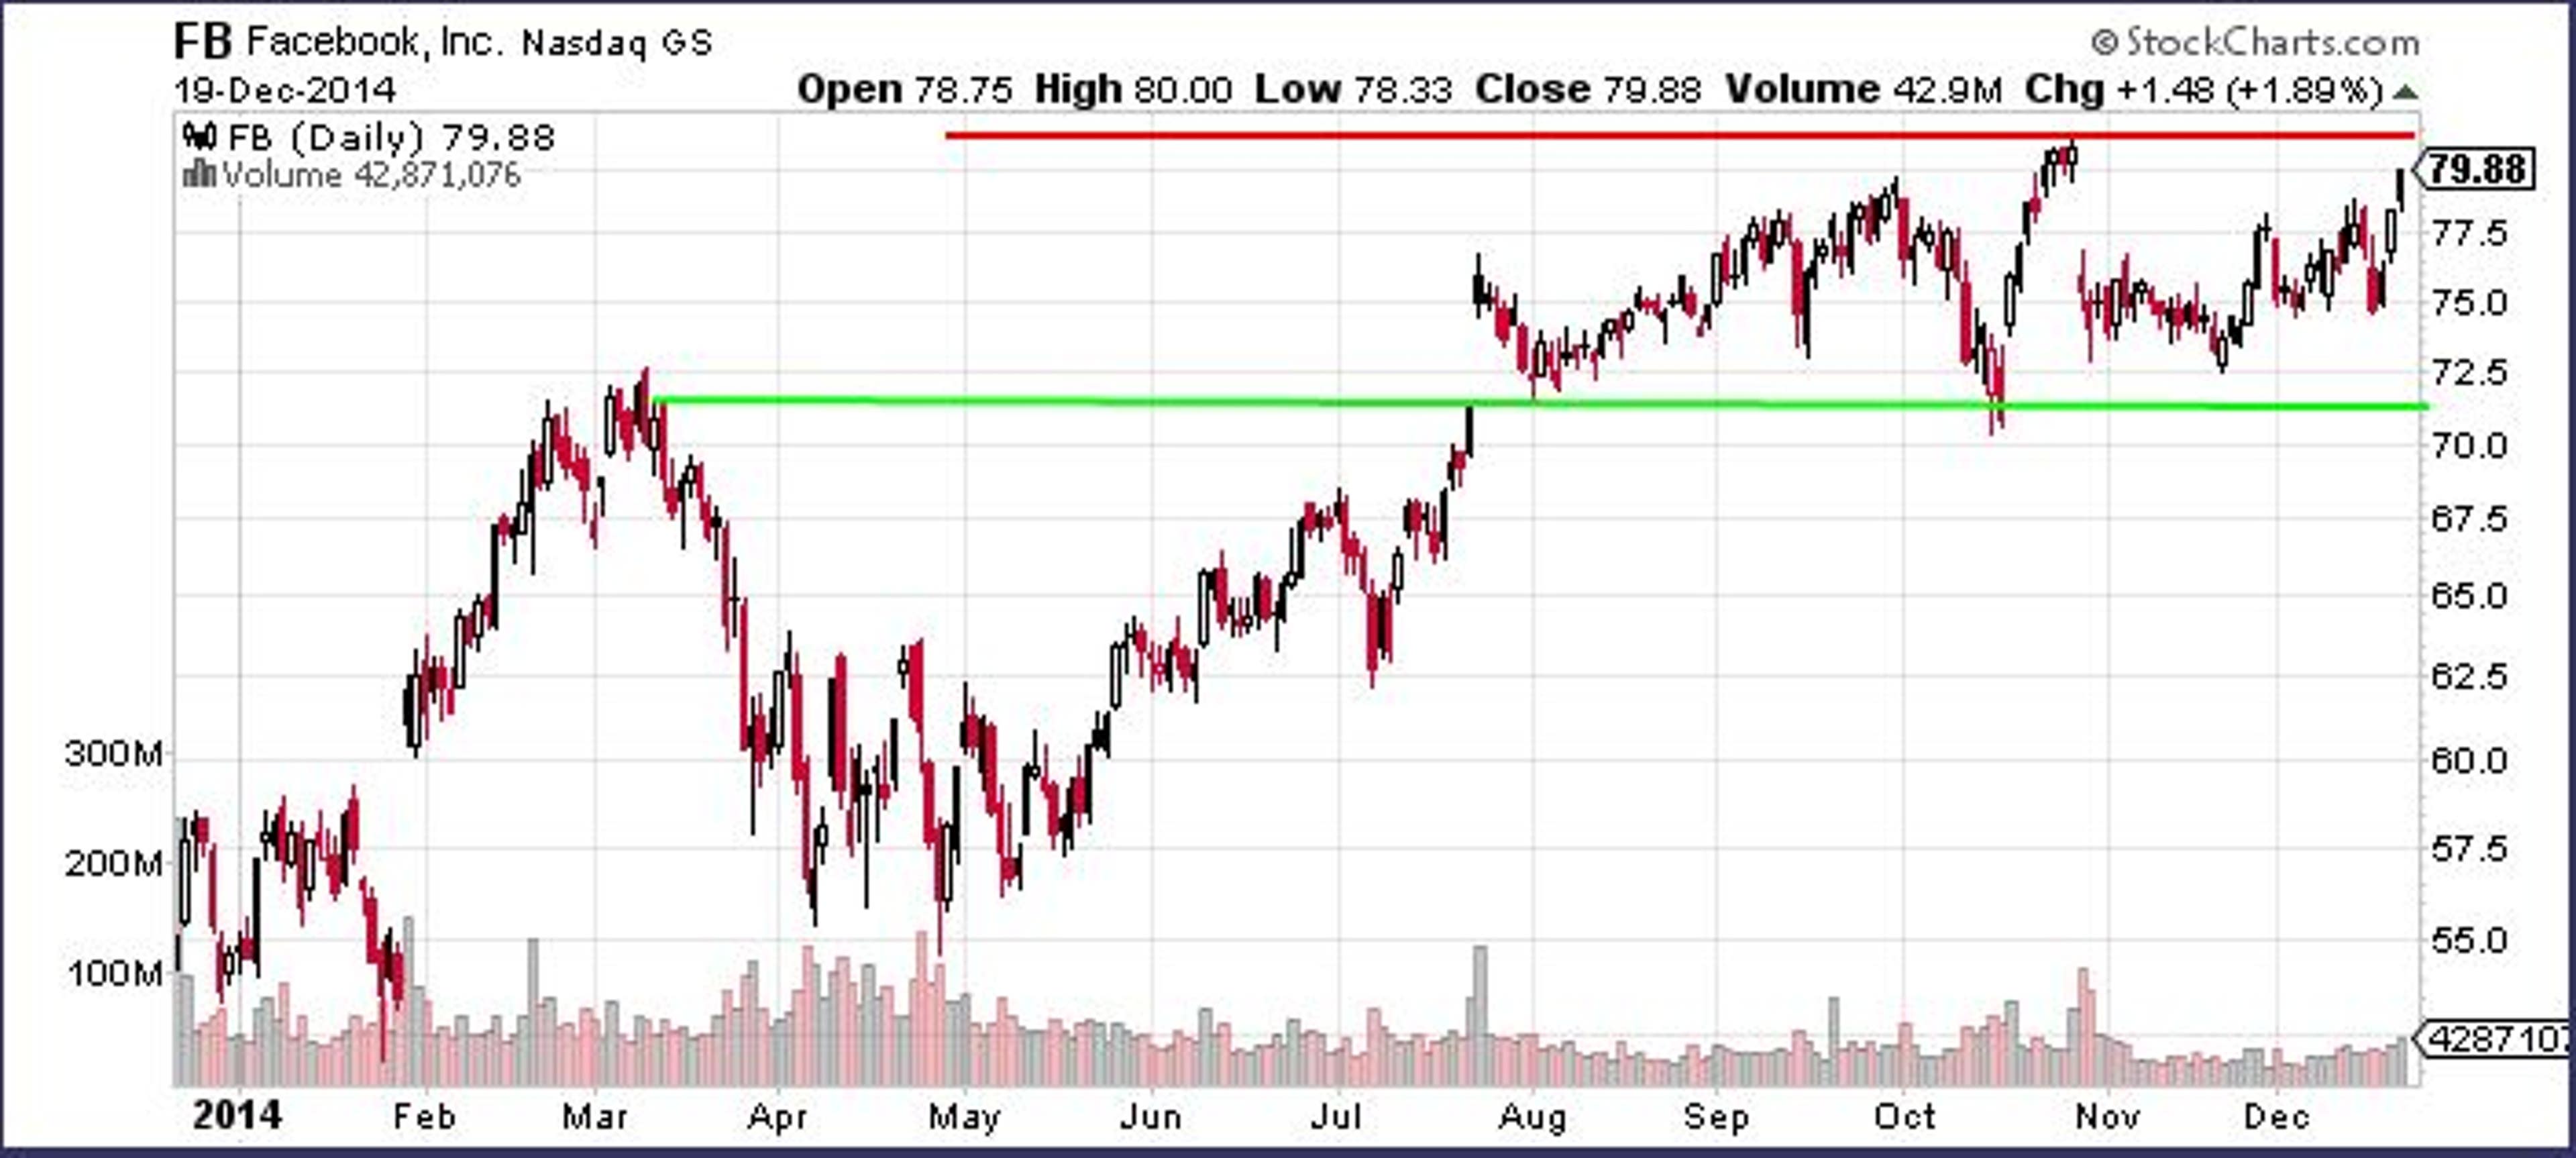
However, Facebook’s 2.6 percent climb last week has it approaching an important resistance point. Back in late October of this year, Facebook reached an all-time high of just over $81.
Since that time, the stock has pulled back as low as $72.51, but it closed the week at $79.88. If the stock is to hold above its all-time high, it will have to break out of the channel it has been trading inside for nearly five months.

The stock was making new all-time highs nearly every month. However, the climb hasn’t been as steep in the second half of 2014.
The good news for shareholders is that the stock seems to have some fairly strong support around $72 at the bottom its current trading channel. The $72 level was a major resistance level back in March, and since Facebook finally broke above that level in July, the stock has never dipped significantly back below it.
For now, the key level for Facebook breaking above the previous all-time high of $81. Given the recent news, worries of a bearish double top may be unfounded.
© 2024 Benzinga.com. Benzinga does not provide investment advice. All rights reserved.
Trade confidently with insights and alerts from analyst ratings, free reports and breaking news that affects the stocks you care about.

