With the GBP/USD resting nicely between 38.2% - 50% Fibonacci...

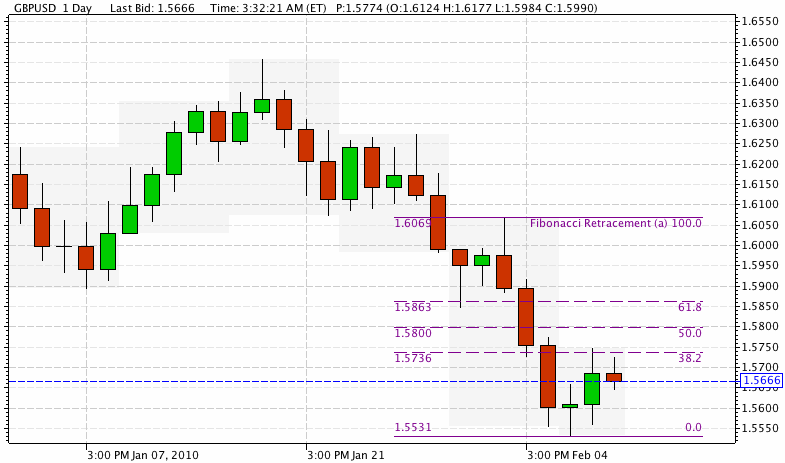
Daily chart of GBP/USD

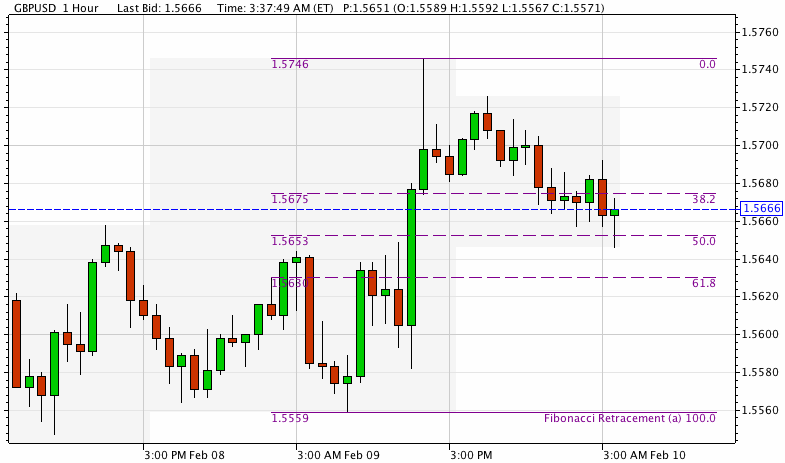
Hourly chart of GBP/USD
With the GBP/USD resting nicely between 38.2% - 50% Fibonacci retracement on its hourly chart, sterling looks poised to strengthen further. However, I do note the breach of the 50% Fib level.
The market is nicely positioned and seems to be expecting GBP-positive news from today’s industrial production report and the BoE’s inflation report. We all know that UK economics have been bleak but the bright spots have been housing and manufacturing. The IP report may, therefore, be good for cable. BoE officials have made comments about inflation and its effect on monetary policy in the short term in recent months. Any hints of this hawkish sentiment (ie, showing signs of concern for higher inflation) could really buttress this recent rally further back towards 1.5750 and even above this level.
A break above 1.5750 potentially targets 1.5800, the 50% Fibonacci level on the daily chart. On the flip side, watch 1.5625 to the downside. That price point marks the halfway thru point and also sits close to 61.8% Fibonacci retracement level on the hourly chart. A sustained break of this level sends price back towards 1.55 and support at 1.5550/60.
Be mindful of news today and trade what you see!
The preceding article is from one of our external contributors. It does not represent the opinion of Benzinga and has not been edited.
© 2024 Benzinga.com. Benzinga does not provide investment advice. All rights reserved.


