


The following is a light version of Beyond The Fundementals Now, a daily newsletter from leading technical analyst and CNBC contributor Matt Maley. Click here to access more detailed analysis.
Some important technical damage has been done in TSLA's chart
Every once in a while we hear the phrase, “This development is a dagger to the heart of…”. We hear it in politics, in sports, and even sometimes in the market place. We don’t know yet if this week’s new on Tesla TSLA is quite severe enough to be called a “dagger to the heart”, but it is certainly a “dagger to the chest” of TSLA, at least on a technical basis. In other words, this week’s reaction in the stock to the poor earnings report and the exit of its second most important executive has given us a situation where it can certainly be called a “dagger to the chest”. The action in TSLA this week might not be a “dagger to the heart,” but some genuine damage has been done to several internal organs.
Yes, 50% rallies can be "failed rallies"
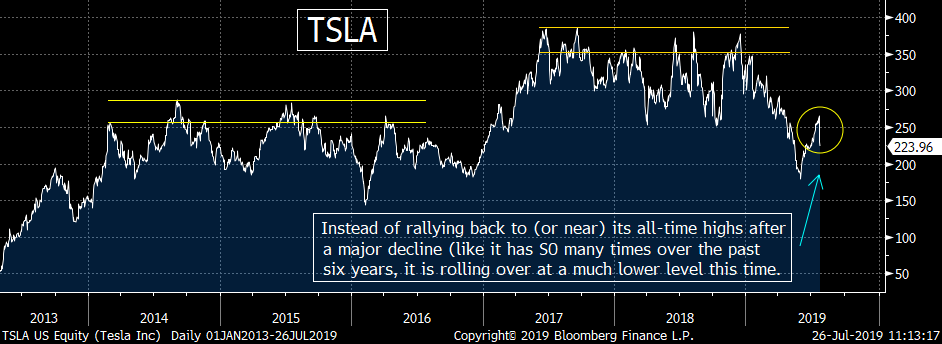
As I highlighted in a CNBC interview, we can see this damage by looking at three charts on TSLA. Looking at the first chart, it shows that TSLA has obviously seen many very large swings over the past five or six years (in both directions). As scary as the 20%-50% sells have been since 2013, they have always been followed by powerful rallies that took TSLA back up to, or at least very close to, its old record highs! That’s right, believe it or not, there have been eleven declines in TSLA of 18%-52% since the second half of 2013 (with eight of them giving us drops of over 30%), but each one has been followed by a rally back to its old highs…until now!
Click here to see the CNBC interview: https://www.cnbc.com/video/2019/07/25/this-key-lev...
In other words, even though TSLA’s 50% rally off the June lows seems to be very impressive on a stand alone basis, it’s really at the low end of the rallies it has seen after other major declines over the past six years. Seven of these rallies were between 50% and 110% (with two at that upper level)! More importantly, the previous rallies all took the stock up to/near its all-time highs. From 2014 to 2016, the rallies brought TSLA up into the $250-$280 range. Once it broke higher in 2017, a new “record range” was established. Therefore, in 2017 & 2018, the rallies that followed large declines took the stock up into the $355-$385 range.
However, this has all changed during the most recent bounce. Although TSLA rallied more than 50%, it stalled out more than 30% below its old highs. So, instead of retracing 100% of its decline (or at least close to 100%), it only retraced about 40% of the drop. Therefore, unless TSLA bounces back IMMEDIATELY, it will show that the most recent rally is a “failed rally” and it won’t get anywhere near its old highs going forward.
Get actionable calls at turning points with BTFNow from Matt Maley. Use code 14free for two FREE weeks of BTFNow.

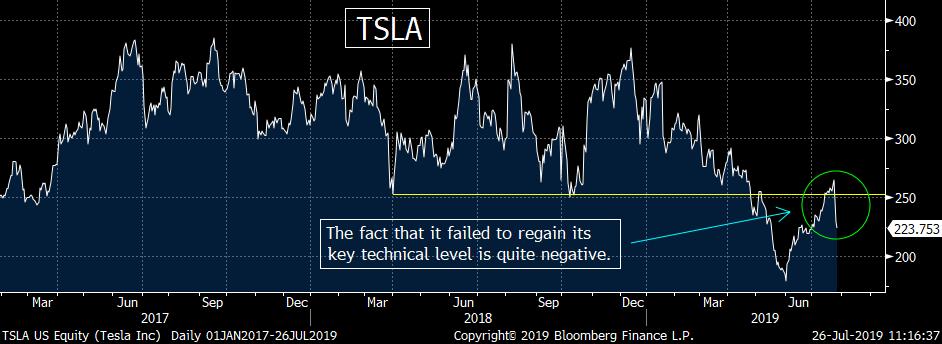
TSLA has also failed to regain it's "old support" level....not good.
The bearish evidence does not end there, however. I’d also note that TSLA has “failed” in its attempt to regain the all-important $250 level. That was the “old support” level as it bounced strongly off that level in April and October of 2018. So when it broke below that level in May, it fell another 30%. The stock was able to regain that level for a few days, but yesterday's 14% decline (and today’s -2% downside follow-through) has taken TSLA back below that key level in a significant way. This is another classic sign of a “failed” rally. It may sound crazy to say a 50% rally can be called a “failed rally”, but given the huge swings in this stock over the years, it’s not as crazy as it sounds.
$178 is the "line in the sand" level for the stock
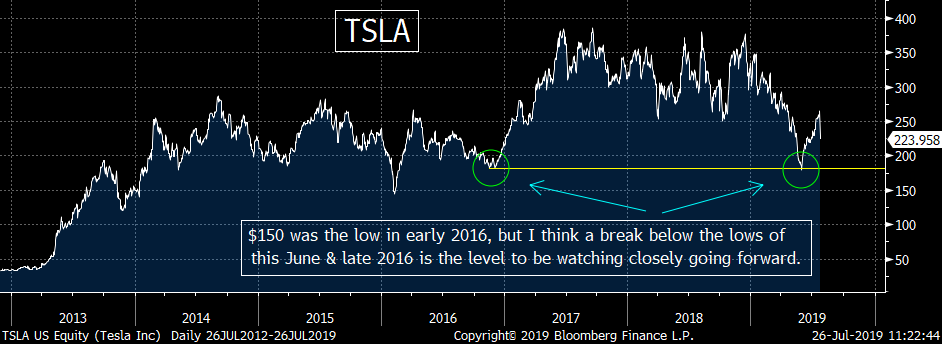
Okay, so some serious technical damage has been done to TSLA, but what does it all mean for the stock going forward? Well, since I believe that the recent action is strong evidence of a “failed rally”, I think it could go much lower, and a retest of the June lows is probable. The bigger question is whether it can hold those June lows of $178 or not. This is will be vitally important as I see that $178 level as the “line in the sand” for TSLA! Not only was $178 the low for the stock back in early June, but it is also the low from late 2016. Therefore, I believe any break below that level will cause a lot of the faithful “believers” in TSLA to lose a lot of confidence in the stock and throw in the towel.
I do need to point out that TSLA fell all the way down to $150 in early 2016, so some technicians will point to that level as the more important “line in the sand" level. However, after the most recent news (which raises questions about profitability) and the departure of Mr. Straubel, I believe a break below the 2016/2019 lows will be enough to cause a lot of people to lose more confidence in the promises they keep hearing from Elon Musk.
© 2024 Benzinga.com. Benzinga does not provide investment advice. All rights reserved.
date | ticker | name | Price Target | Upside/Downside | Recommendation | Firm |
|---|
Trade confidently with insights and alerts from analyst ratings, free reports and breaking news that affects the stocks you care about.

