


Houston, do we have a problem?
Essentially that is a question investors need to answer in order to decide if buying Eastgroup Properties Inc EGP on weakness is something that should be up on their radar screen.
EastGroup owns a portfolio of industrial properties totaling over 35.2 million square feet. Major markets include Florida, Arizona, California, North Carolina and Texas. The company primarily focuses on flex-space and smaller tenants in the 5,000 square foot to 50,000 SF range, rather than bulk distribution warehouses.
Analyst concerns for fiscal year 2015 and 2016 are mainly focused on Houston, which represents ~21 percent of base rent and ~38 percent of future development, due to the weakness in oil prices.
Recent Analyst Tug-Of-War
In a December 3 note by Stifel Nicolaus, "Slippery Stock" (a reference the recent price drop of oil), the investment bank downgraded EastGroup from Hold to Sell. Sell ratings are quite rare on Wall Street, especially for well-managed equity REITs which own institutional quality commercial real estate.
KeyCorp also downgraded EastGroup from Hold to Underweight.
Bank of America reiterated a Neutral rating on EastGroup reducing its price target from $70 to $68.
Two days later, EastGroup announced its 140th consecutive quarterly dividend of $0.57, representing an annual yield of just under 3.5 percent based on a share price of $65.50.
On December 8, Credit Suisse weighed in by upgrading EastGroup from Underperform to Neutral with a $69 PT -- a ~5.35 percent upside from $65.50. Coincidentally, $65.50 per share happens to be the net asset value (NAV) calculation by Credit Suisse for the EastGroup underlying portfolio of industrial properties.
Characteristics Of Well-Managed REITs
Usually, well-run equity REITs trade at somewhat of a premium over NAV in a nod to the increases in value, which can flow from a well-managed portfolio.
Positive indicators include high occupancy, contract rent increases, an accretive acquisition pipeline, the dividend track record, as well as a strong balance sheet. All of these factors help to lower the cost of capital and increase future cash available for distribution to shareholders.
EastGroup Q3 Results
Here are some key metrics from the quarter ended September 30:
• Leasing: 96.8 percent leased, 96.2 percent occupied; renewed or released 88 percent of expiring SF during the quarter.
• Rental Rates: New and renewal leases increased an average of 6.9 percent during Q3.
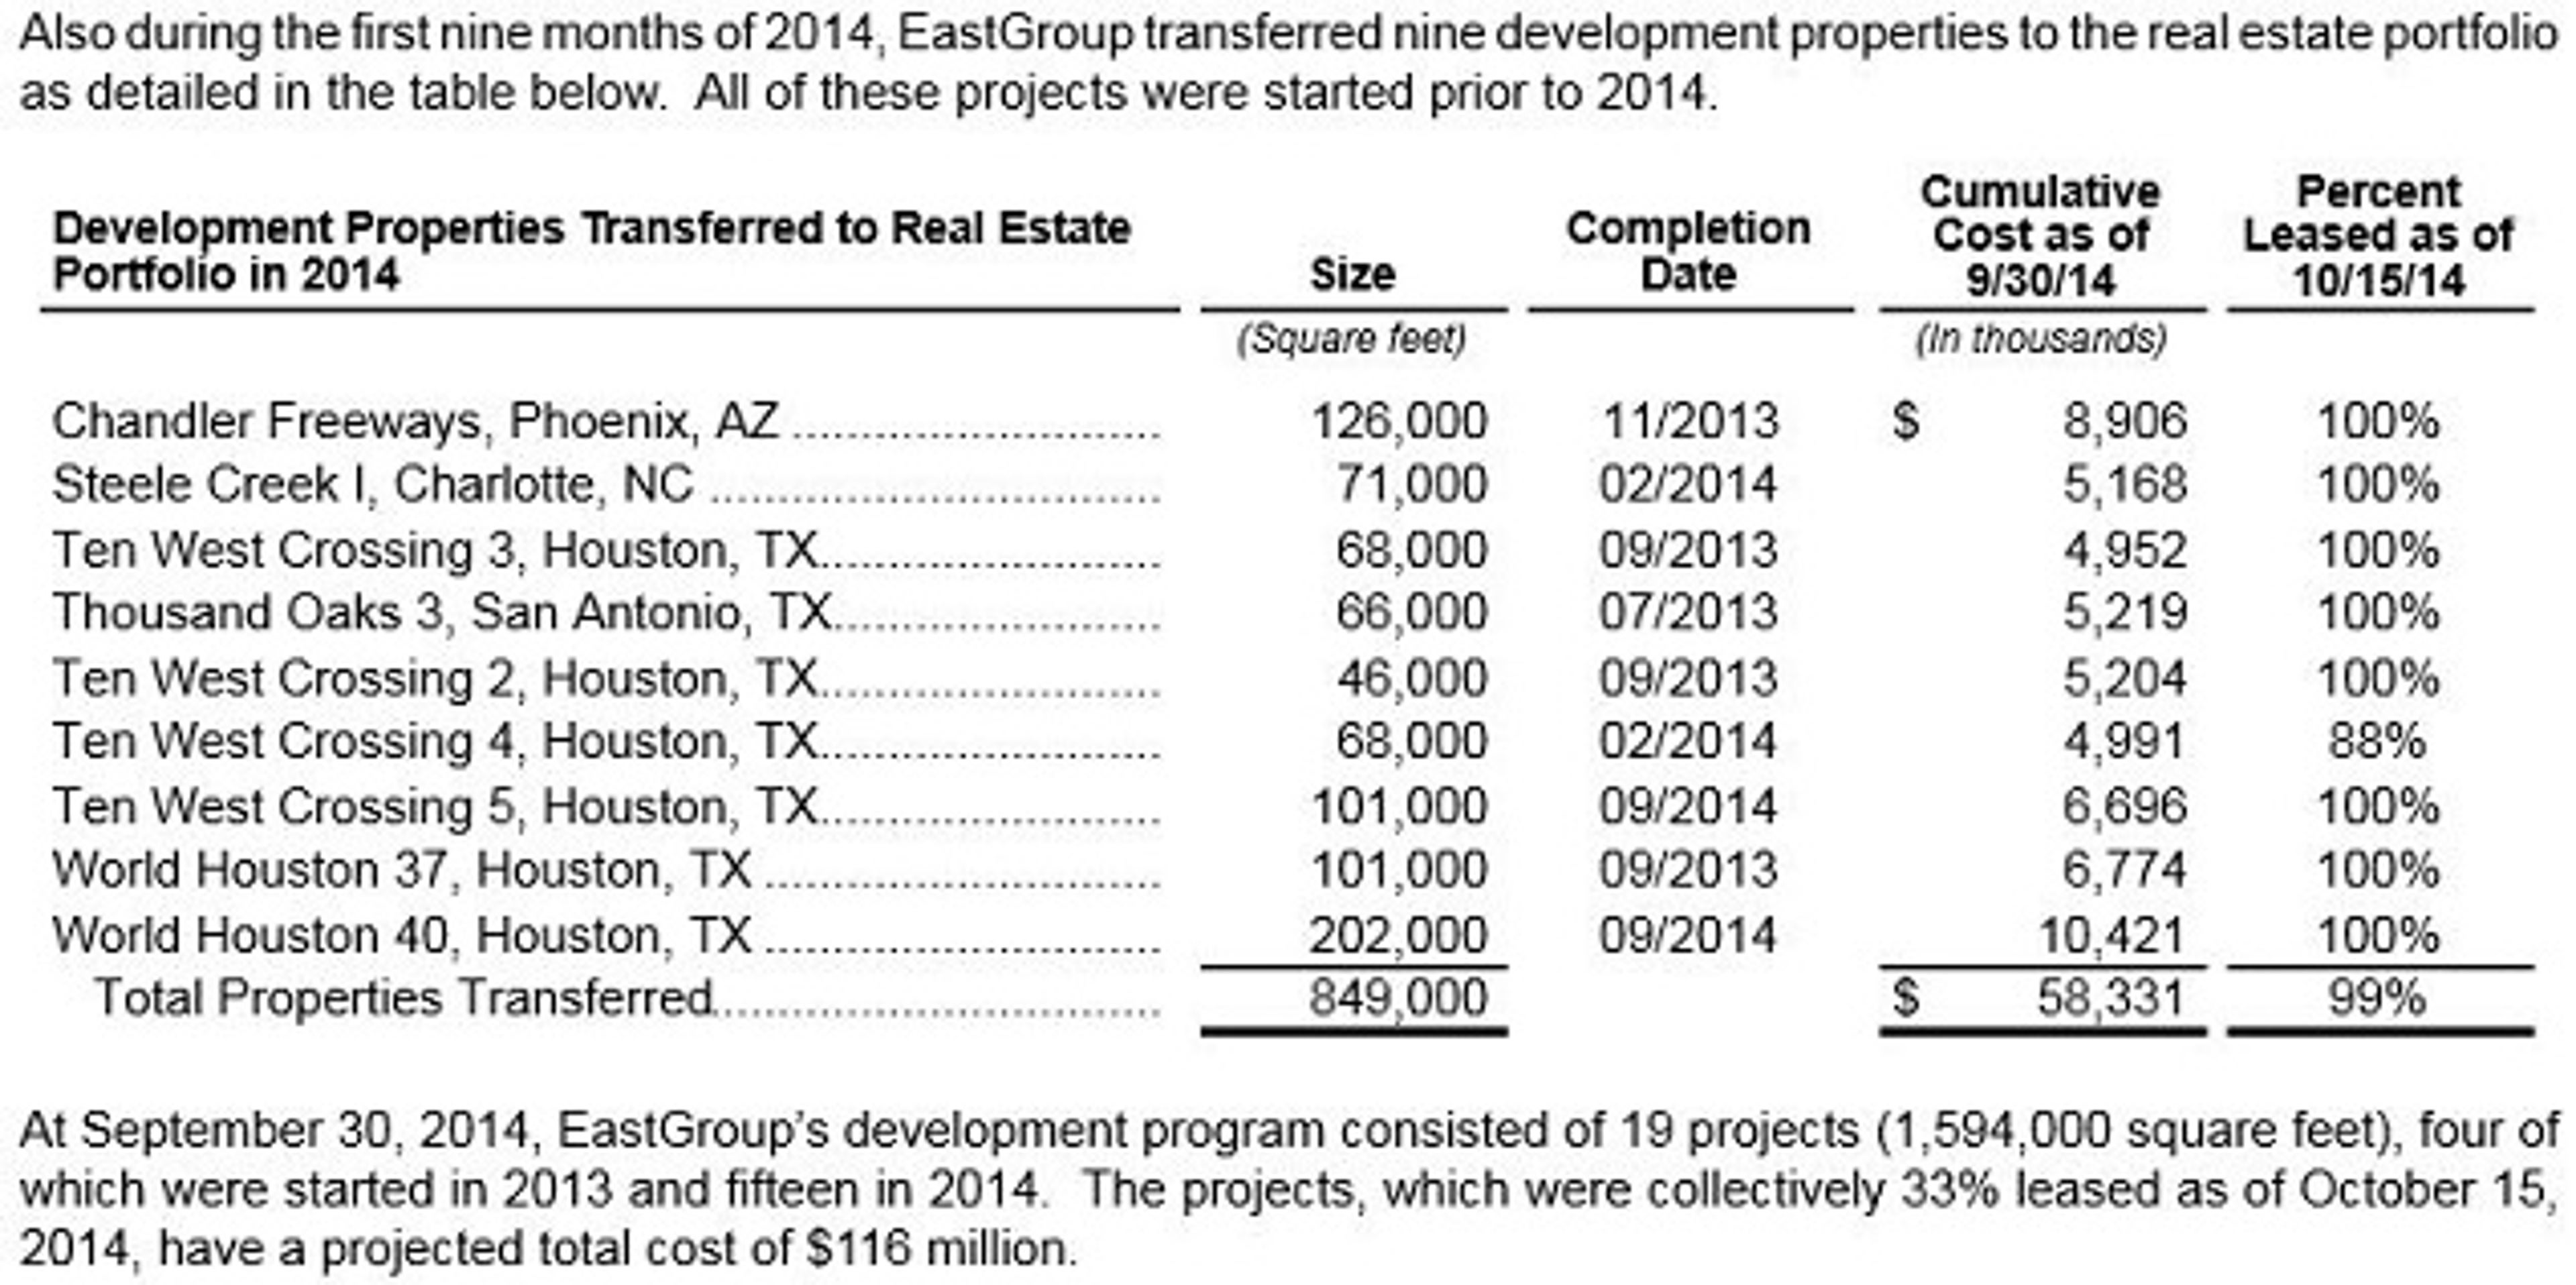
• Development Program: 19 projects totaling 1.6 million SF, with a projected total investment of $116 million.
• Funds From Operations: FFO increased from $0.83 to $0.89, or 7.2 percent per share Y/Y.
• Dividends: Paid 139th consecutive quarterly cash dividend; increased the dividend 5.6 percent from $0.53 to $0.57 per share.
• Balance Sheet: Debt-to-total market capitalization of 32.3 percent as of September 30; interest and fixed charge ratios both at 4.2x

New Development - Deeper Dive
Here is the development recap from the EastGroup Q3 earnings announcement:

Bottom Line
EastGroup Properties is a conservatively managed industrial REIT that has been hitting on all cylinders year-to-date.
Development properties during 2014, which were added to the same store real estate portfolio, were largely focused on Houston, and notably almost 100 percent occupied.
Investors evaluating EastGroup's near term and future prospects need to factor in how potential head winds in Houston might actually result in lower FFO for 2015 and 2016.
Investor Takeaway
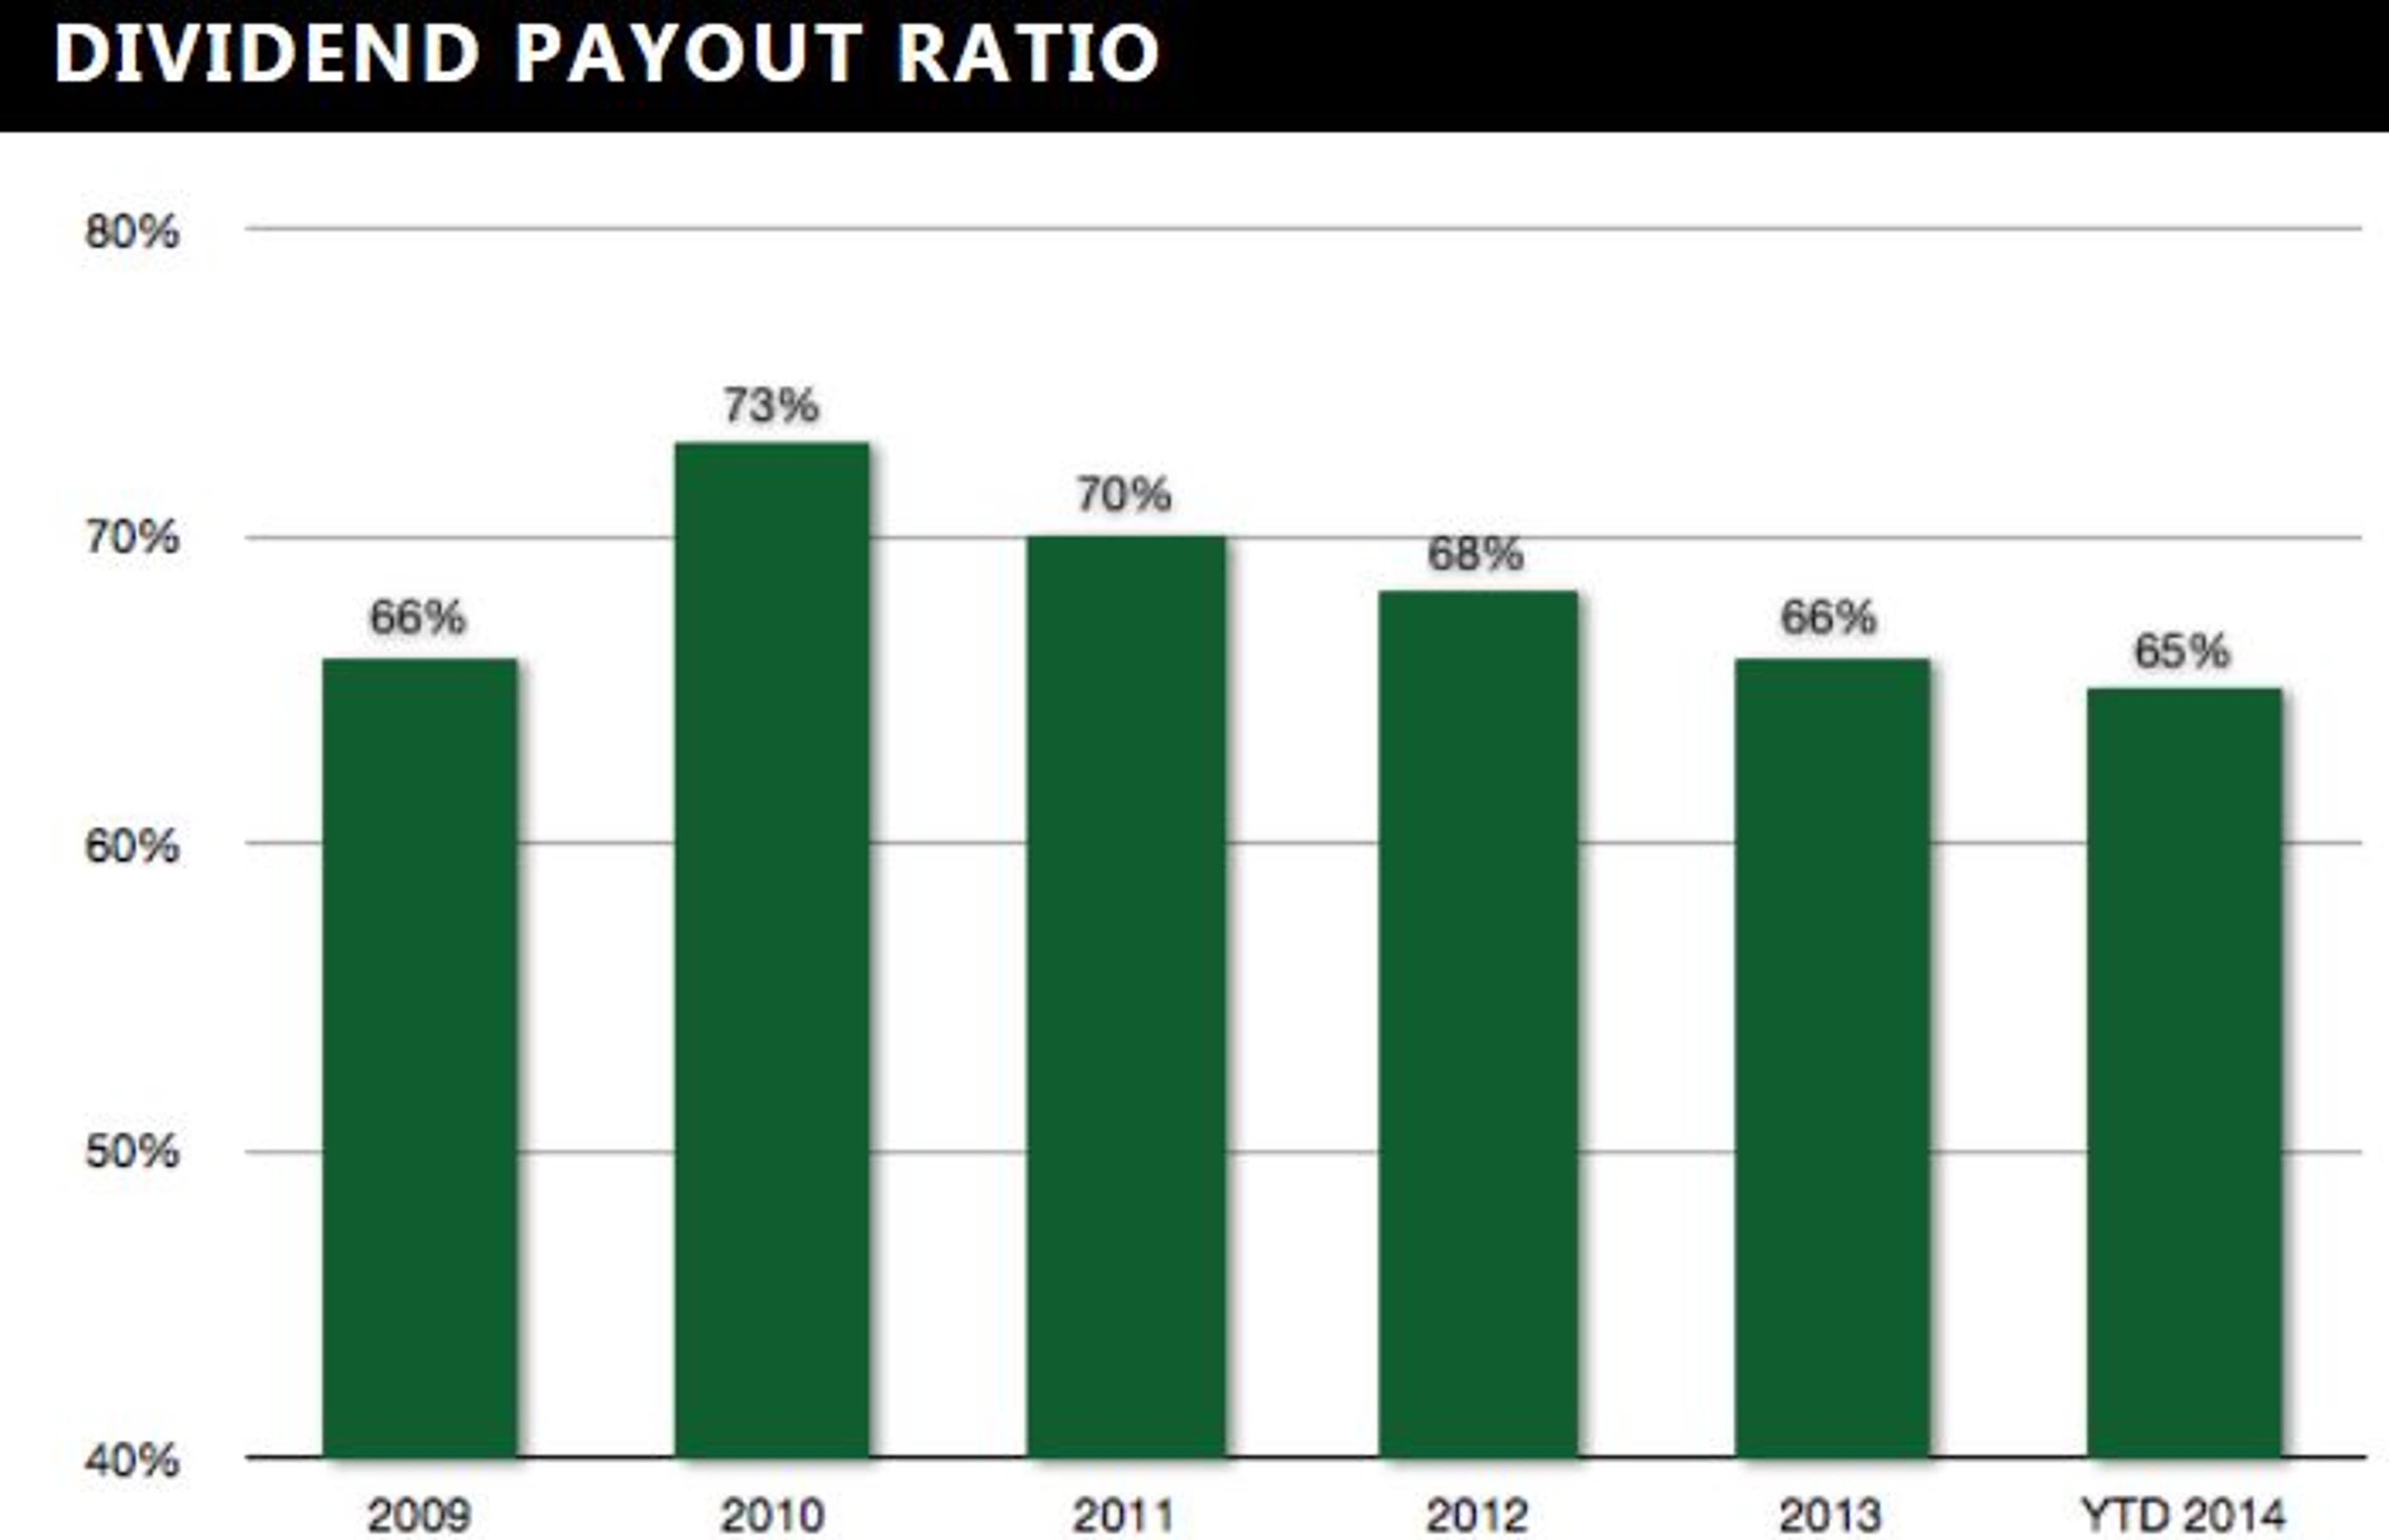
It is very difficult to predict the future direction of oil prices and interest rates. Based upon EastGroup's outstanding dividend track record and low dividend pay-out ratio, long-term investors may want to keep this well-managed REIT on the radar screen.
© 2024 Benzinga.com. Benzinga does not provide investment advice. All rights reserved.
date | ticker | name | Price Target | Upside/Downside | Recommendation | Firm |
|---|
Trade confidently with insights and alerts from analyst ratings, free reports and breaking news that affects the stocks you care about.

