More TV Sets (2.93) Than People Per US Household (2.54); Average TV Sets Per Home Sets New Record
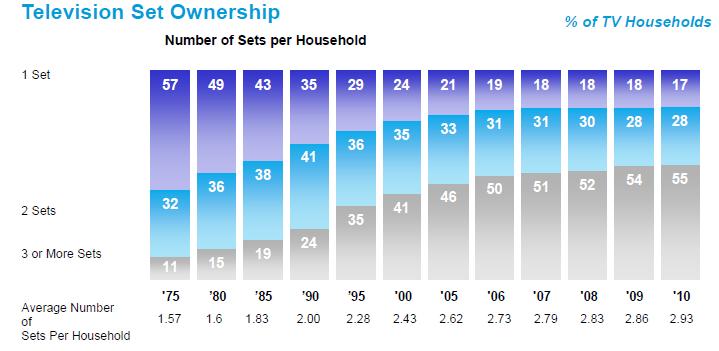
The average American home now has 2.93 TV sets per household, up from 2.86 sets per home in 2009, the largest year-over-year increase since 2006 according to Nielsen’s latest Television Audience Report (see chart above). In 2010, the number of U.S. homes with three or more TV sets increased to the highest percentage ever at 55% (up from 54% last year and up from 11% in 1975) and the number of households with only one TV decreased to the lowest level ever, at 17%, down from 18% last year, and down from 57% in 1975. The report also finds that the number of people per TV home has held steady at about 2.54 for the last six years, carrying on the trend of more TVs per home than people.
Other highlights:
1. Since at least 2005, there have been more TVs per household on average than people per household.
2. In 1975, there were only 1.57 TVs per household, when the average household size was 2.88.
3. Since at least 1995, more households have three TV sets than the number of households with only one TV.
4. There has been almost a complete reversal between 1975 and 2010: In 1975, 57% of American households owned only one TV set, and by 2010, 55% of households owned three TV sets.
5. Interestingly, during the "greatest economic crisis since the Great Depression," the number of American households with three TV sets increased to the highest level in U.S. history, and the number of households with only one TV set decreased to the lowest level in history.
The preceding article is from one of our external contributors. It does not represent the opinion of Benzinga and has not been edited.
© 2024 Benzinga.com. Benzinga does not provide investment advice. All rights reserved.