


Loading...
Loading...

The company CoreLogic calculates and reports a monthly home price index (HPI), similar to the Case-Shiller Home Price index, and is being featured on CD for the first time today. The CoreLogic HPI is a "repeat-sales index that tracks increases and decreases in sales prices for the same homes over time, which provides a more accurate "constant-quality" view of pricing trends than basing analysis on all homes." CoreLogic's HPI covers median home sales prices in 6,500 U.S. zip code areas and 1,119 counties in all 50 states.
Two key differences between the Case-Shiller and CoreLogic home price indexes are: a) CoreLogic releases home price data a month earlier (now available for April) than Case-Shiller (now available for March), and b) CoreLogic reports two price indexes - one that includes all single-family homes (like Case-Shiller) and another home price index that excludes distressed sales (short sales and REO transactions). In that way, we can track home prices in the "healthy" sector of the real estate market independently of the distressed part of the market.
In its June 1 release (available here with registration), CoreLogic reported that its April HPI increased on a monthly basis by 0.7% compared to March, the first monthly increase in home prices since the home-buyer tax credit expired in mid-2010. On an annual basis, home prices declined by 7.5% in April. Excluding distressed sales, the HPI increased by 1.78% on a monthly basis in April, and declined by only 0.45% on an annual basis.
Mark Flemming, chief economist of CoreLogic commented that "the first month-over-month increase in the HPI since government support for home buying was removed provides reason for cautious optimism" about the U.S. housing market.
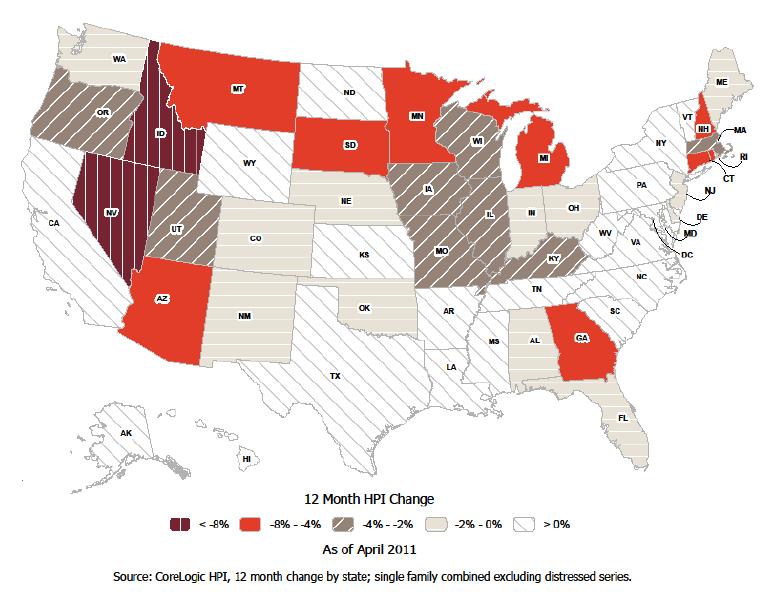
The maps above from the CoreLogic June report show an interesting pattern: the top map displays the annual change in the HPI for all homes, and shows that only six U.S. states have positive 12-month rates of appreciation through April (white states). Excluding distressed sales, the bottom map shows that there are 20 states that have positive rates of appreciation through April, led by W. Virginia (8.4%), S. Carolina (6.1%), Hawaii (5.8%), Mississippi (5%) and N. Dakota (4.5%).
Bottom Line: Distressed home sales are dragging down overall home prices and mask the fact that home prices in the "non-distressed" sector of the market are actually starting to show some healthy, positive appreciation.


Loading...
Loading...
© 2024 Benzinga.com. Benzinga does not provide investment advice. All rights reserved.
Benzinga simplifies the market for smarter investing
Trade confidently with insights and alerts from analyst ratings, free reports and breaking news that affects the stocks you care about.
Join Now: Free!
Already a member?Sign in

