


Stock market and Forex analysis from AVA FX
June 27, 2010 | Leave a Comment
By: csw8
Summary
- Quick Week In Review and Meaning For Next Week
- The S&P 500 Technical Picture: Rally Finished
- Alignment of Bullish And Bearish Forces
Coming Weeks
- EU Debt Crisis
- Wildcards: Watch For Updates On
- China cooling: real estate transaction volume down 70% since mid-April
- US pre-earnings and earnings announcements
- Economic Calendar Events:
USD:US Monthly Jobs Reports and Their Leading Indicators like ADP Non-Farms Payrolls, ISM Mfg PMI
Other: Sunday Day 2 G20 Meetings, Monday: NZD NBNZ Business Confidence
- Longer Term – Beware The Coming US Real Estate Debt Crisis Part II: American PIIGS
Quick Week In Review and Meaning For Next Week
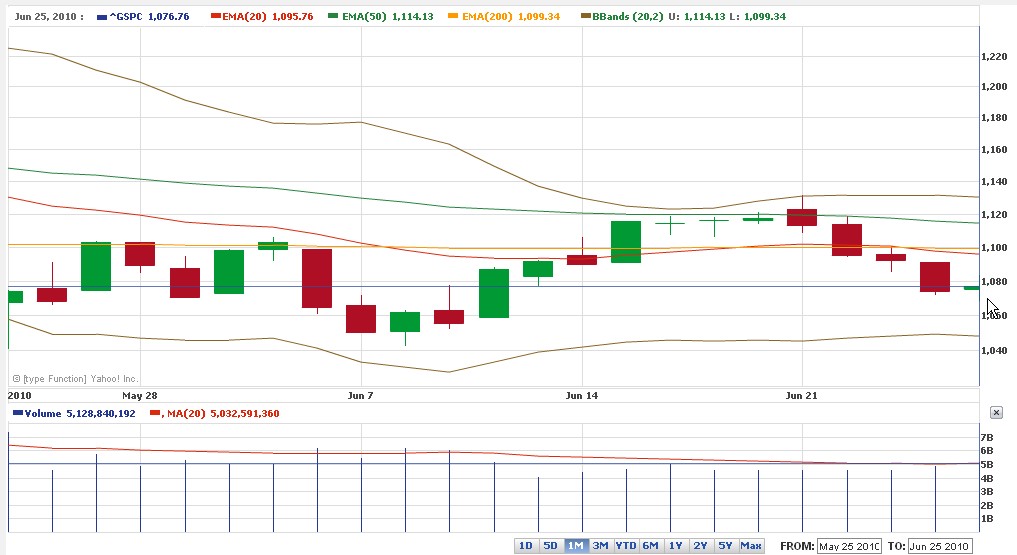
S&P 500 Daily Chart, 1 Month 12jun27
Monday June 21st: CNY revaluation announcement Saturday sparks short risk rally in Asian and European markets, then fades in the US as markets realize it’s unclear if China is actually serious. The CNY would rally later in the week with the approach of the G20 meeting, but like the Saturday announcement, is likely aimed at defusing a potential China bashing at the G20.
Tuesday June 22nd : Markets drop on a combination of profit taking as markets hit technical resistance levels, new concerns about European banks, and US housing. Specifically:
- Technical Resistance Prompts Profit Taking: As illustrated in the above S&P 500 daily chart, this bellwether index failed had failed Monday to close above its 50 day moving average, suggesting this key level would hold until there was new positive data.
- European Bank Concerns: News that Standard & Poor’s upped their estimates on loan losses for Spain’s banking sector, along with a credit rating downgrade of BNP Paribas
- US Existing Home Sales Disappoint: US markets attempted an advance despite the banking news but then fell back on the latest existing home sales figures, which decreased 2.2% from April to May, to an annualized rate of 5.66 million units, below the forecasted rate of 6.12 million units per year. Both homebuilders and home improvement retailers fell almost 3% as investors considered the implications of a slower recovery in housing.
Wednesday June 23rd: The worst new home sales figures on record acted as a drag on trade and the FOMC failed to deliver any positive news to market participants. Reports that new home sales for May fell almost 33% month-over-month to an annualized rate of 300,000 units sent markets to session lows. Not only was that far below the rate of 430,000 units that had been expected, but it was the lowest rate since records began over 45 years ago. Markets also note that the sharp drop on Tuesday in the S&P 500 saw the index close below its 200-day moving average for the second time in the last four weeks, a sign that equities could struggle in coming months.
Thursday June 24th: Disappointing US Durable goods data, continued widening costs to insure against default on PIIGS bonds (hitting a record for Greece, implying a 69% chance of default in the coming years) combine with gloomy news Wednesday to spark another sharp drop in risk assets, as reflected in the above S&P 500 chart. The index was down 3.9% for the week already, its worst 4 day drop in 7 weeks.
Friday June 25th: Stocks closed nearly flat on lackluster reports on GDP growth and consumer sentiment, though commodities, especially energy, surged on dollar weakness. As the above chart shows, the index ended the week at just below 1076, wiping out about 66% of the gains of the rally that began June 8th and ran from 1050 to just over 1120.
The S&P 500 Technical Picture: Rally Finished
We’ve said for the past 3 weeks that rally was just a technical bounce, and this past week confirmed it.
The week’s price action decisively worsened the index’s technical picture for the longer term, and given the S&P 500’s status as THE risk appetite indicator, the technical picture for risk assets in general.
A few points to note about the below S&P 500 weekly chart:

S&P500 WEEKLY CHART COURTESY OF AVAFX 17JUN25
By closing at 1076, the week’s price action left the index (and again, by extension risk appetite in general) closing :
Below its 23.8% Fibonacci retracement level at 1086.05 as traced from the beginning of the March 2009 rally
Below its 38.2% Fibonacci retracement level at 1087.03 as traced from the beginning of the July 2009 rally
Below its 50 week moving average
In its Bollinger Band ‘sell zone’ (between the lower bands of the 1 and 2 standard deviation Bollinger Bands-the lower 2 blue lines)
The week also created a classic bearish ‘engulfing’ candlestick pattern, which not only wiped out the past 2 weeks’ candlesticks but also took the index and overall risk asset position back to the lows of early February 2010.
In sum, the nascent reaction bounce rally hit a wall of bad news on US housing, European banking, Yuan revaluation doubts, and technical resistance that sent markets lower. Gold and oil essentially flat on the week. Markets boost the GBP, the strongest currency for the week, on the new austerity budget to cut the UK deficit.
However for a more sustained GBP rally we’ll need to see positive growth data that suggests the new austerity won’t kill the UK recovery. Given that much of the austerity measures don’t take effect until next year, the UK could yet see some adequate growth figures and give the GBP rally further life, especially if the US and Europe continue to struggle.
Alignment of Bullish And Bearish Forces
See our special article: The Current Alignment Of Bullish And Bearish Forces – a summary of the big picture and what will change it.
We don’t see a big dive coming until autumn (traditional crash season), unless we get another major bearish event. The most likely sources of really bad news are either the EU sovereign debt crisis (the reigning top market driver) or the former champ and rising challenger, the US real estate crisis.
Coming Week Primary Market Movers
The EU Sovereign Debt Crisis
While the latest EU/IMF €750 bln package is supposed to be adequate to prevent default for 1-3 years, enough time for EU officials to figure out the most ‘orderly default,’ and for the overexposed banks to recapitalize so that when sovereign dominos begin to fall they have a better chance of surviving, or will at least require less of a bailout. For more on this idea see Michael Pettis’ excellent article here.
However, the crisis now moves with very unpredictable sentiment. As the past weeks have shown, markets are now so nervous about the EU and its inability to control the crisis (justifiably) that sentiment has become very unstable and thus unpredictable. This isn’t unreasonable.
At minimum the banks of Greece, Portugal, and Spain are essentially dependent on the ECB for borrowing, given their high exposure to their local high risk debt. We don’t know how long the ECB can serve as their primary lending source, but clearly the stress on the ECB’s finances is rising. Because no one trusts EU leaders to admit to a problem until it’s too late, we’re seeing a vicious cycle of steadily rising credit spreads and borrowing costs for Europe’s weakest economies, further default risk and dependence on the ECB, risk of yet a bigger aid package needed, etc.
As we’ve repeatedly discussed, most recently in Spain- Here Comes The Next EU Sovereign Debt Crisis-Soon Spain has denied 3 separate reports of a coming aid package for its €25 bln in maturing debt in July, and is the likely source of the EU’s next nasty surprise in the coming weeks.
Wildcards: Watch For Updates On
–China cooling: real estate transaction volume down 70% since mid-April
–US pre-earnings and earnings announcements
Economic Calendar Events
Barring a blowup in the EU or elsewhere, the coming week is likely to be dominated by US jobs reports.
USD: Friday US Monthly Jobs Reports and Their Leading Indicators like Wednesday’s ADP Non-Farms Payrolls, Thursday’s ISM Mfg PMI
Other: Sunday Day 2 G20 Meetings, Monday: NZD NBNZ Business Confidence, Tuesday CB Consumer Confidence, Wednesday GBP Final GDP q/q CHF KOF Economic Barometer, CAD GDP m/m, Thursday JPY Tankan Mfg Index, CNY Mfg PMI, AUD Building Approvals m/m, Retail Sales, GBP Mfg PMI
Longer Term – Beware The Coming US Real Estate Debt Crisis Part II: American PIIGS
The next likely big crisis – see What Will Save The Euro? The American PIIGS
Disclosure: No Positions
Visit AVA FX
© 2024 Benzinga.com. Benzinga does not provide investment advice. All rights reserved.
Trade confidently with insights and alerts from analyst ratings, free reports and breaking news that affects the stocks you care about.

